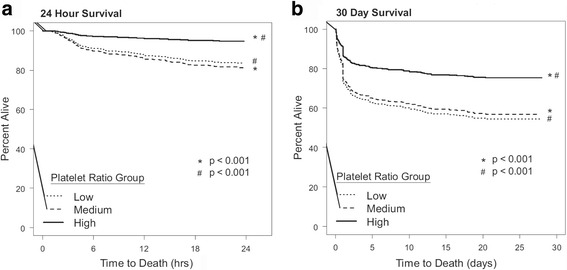
Fig. 4.

Propensity-adjusted Kaplan–Meier survival plot for the first a 24 h and b 30 days after admission. a Propensity-adjusted Kaplan–Meier survival plot for the first 24 h after admission for the three platelet ratio groups: low (1:20), medium (1:2), and high (1:1). b Propensity-adjusted Kaplan–Meier survival plot for the first 30 days after admission for the three platelet ratio groups: low (1:20), medium (1:2), and high (1:1)
