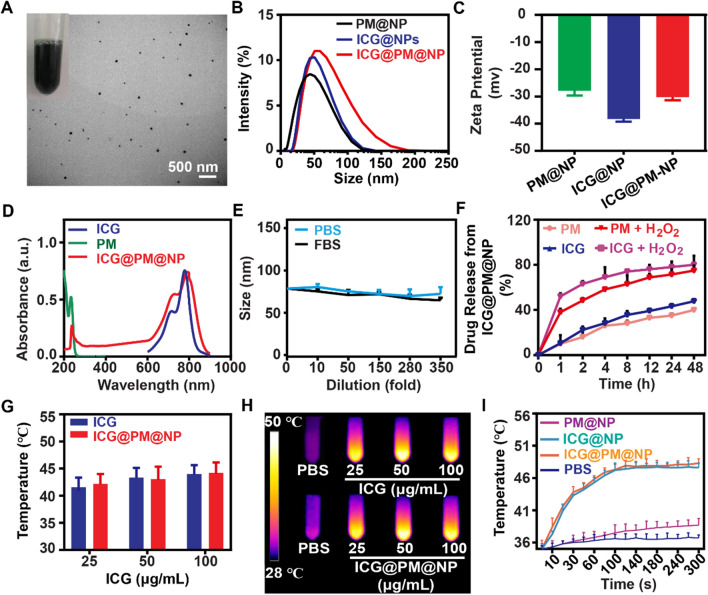
Fig. 2.
Characterization of the ICG@PM@NP. A Representative TEM image of the prepared ICG@PM@NP, scale bar = 500 nm. B Hydrodynamic diameters of ICG@NP, PM@NP, and ICG@PM@NP. C Zeta potential of PM@NP, ICG@NP, and ICG@PM@NP (n = 3). D UV–VIS spectra of free ICG, PM, and ICG@PM@NP in deionized water. E The stability of ICG@PM@NP in PBS and FBS was detected by DLS (n = 3). F Release of PM and ICG from ICG@PM@NP in PBS or PBS plus 100 μM H2O2 (n = 3). G–H Thermal images and temperature variation of different concentrations of free ICG or ICG@PM@NP (calculated by ICG content) exposed to 1 W/cm2 laser for 60 s (n = 3). I Temperature variation curves of the aqueous dispersion of PBS, ICG@NP, PM@NP, and ICG@PM@NP exposed to 1 W/cm2 laser for different time (n = 3). Data were demonstrated as mean ± SD. Statistical analysis was performed via the two-tail Student’s t-test

