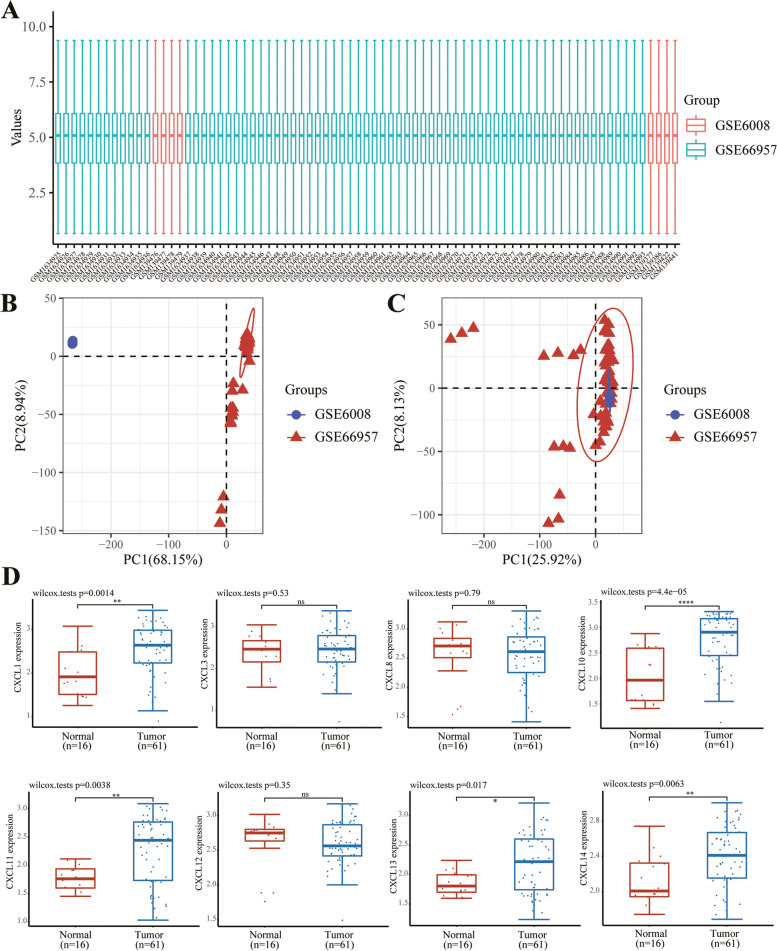
Fig. 7.
The GEO database detects the expression of CXC chemokines in OC. A. Standardization of each sample data. B, C PCA analysis shows the data changes before (B) and after (C) processing, and the intersection of the processed data sets can be used for further analysis. D The expression distribution of CXC gene in tissues, where the horizontal axis represents different groups of samples, the vertical axis represents the gene expression distribution, where different colors represent different groups, and the upper left corner represents the significance p-value test method

