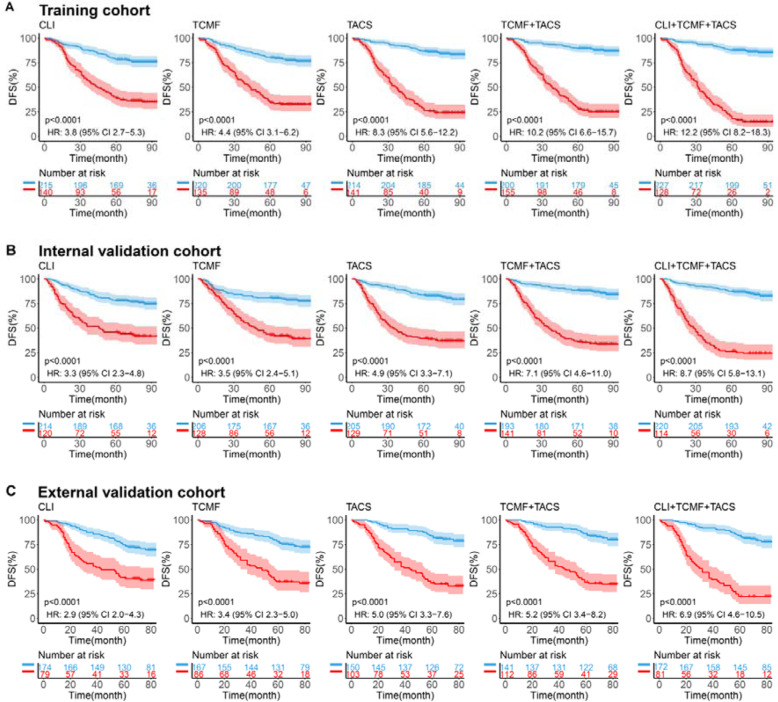
Fig. 4.
Kaplan-Meier curves according to the CLI model, TCMF model, TACS model, TCMF+TACS model, and CLI+TCMF+TACS model in three cohorts. The patients were divided into low-risk and high-risk groups using the optimal cutoff value of the five models. P values were calculated using the log-rank test. Blue lines show subjects with low risk, and red lines show subjects with high risk. A Training cohort (355 patients). B Internal validation cohort (334 patients). C External validation cohort (253 patients). DFS disease-free survival, HR hazard ratio

