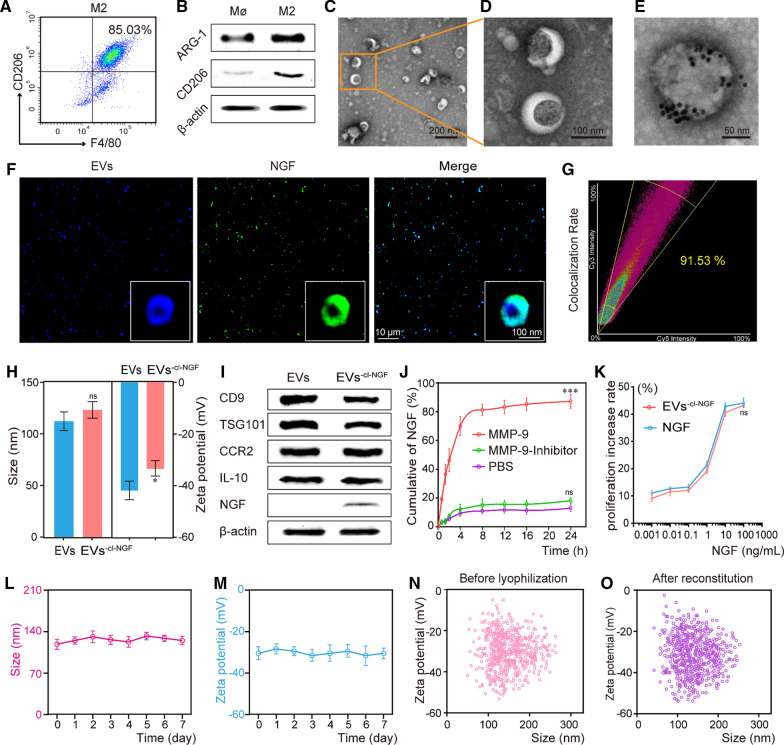
Fig. 2.
Preparation and characterization of EVs−cl−NGF. A Flow cytometry analysis of primary macrophages at 48 h after treatments with IL-4. (Numbers indicated per cent F4/80 + , CD206 + cells). B Western blotting analysis of primary Mø and M2 macrophages. ARG-1 and CD206 was a marker of M2 macrophages. C, D TEM imaging of EVs. E TEM images of EVs−cl−NGF bound with secondary immune-antibody-linked Au nanoparticles. F CLSM images and the STED images (enlarged illustration in the lower right corner) of EVs−cl−NGF, EVs (blue) and NGF (green). G The colocalization rate of EVs and NGF. H The size and zeta potentials of EVs before and after loading NGF. I Western blotting analysis of EVs and EVs−cl−NGF. CD9 and TSG101 was a marker of extracellular vesicles, IL-10 was a functional protein of M2 macrophages, and CCR2 was Inflammatory chemotactic protein. J The release rate of NGF under different conditions (PBS, MMP9 + inhibitor, or MMP9). K Comparison of the activity of NGF released from EVs−cl−NGF to the original NGF. L, M The stability of particle size and zeta potentials of EVs−cl−NGF in PBS for 7 days. N, O Before lyophilization and after reconstitution, the particle size and Zeta potential of EVs−cl−NGF. Data presented the mean ± SD (n = 3 per group) (*P < 0.05, ***P < 0.001 and ns: not significant)

