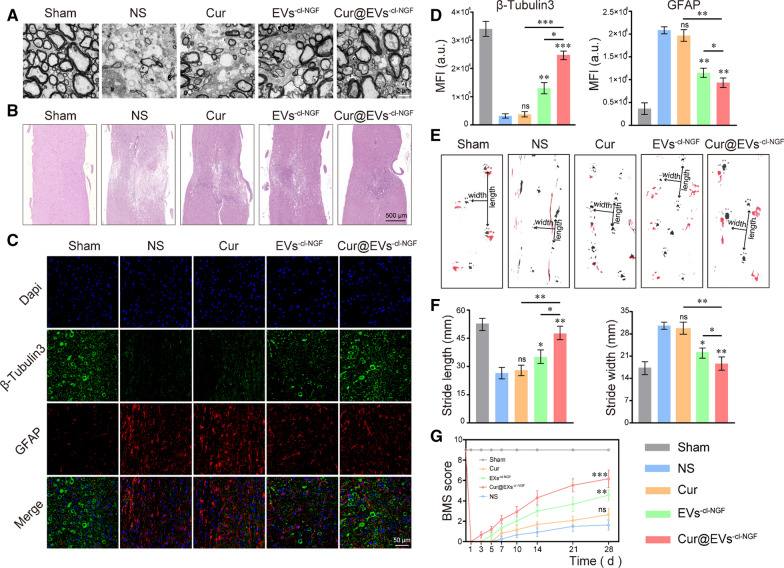
Fig. 6.
Cur@EVs−cl−NGF promotes the recovery of motor function after SCI. A Ultrastructure of myelin sheaths from different groups determined by TEM. B H&E stained images of spinal cord tissue from different groups. C Fluorescence images of spinal cord tissue, in which the green channel represented neuronal axon tubulin (β3-Tubulin) and the red channel represented astrocytes (GFAP). D Fluorescence quantitative statistical analysis of β3-Tubulin and GFAP in figure C. E Representative images of footprint behavioral assays. F Quantitative analysis of stride length and stride width in footprint assays. G Mice motor functional recovery of different groups mice during treatment using BMS scores for statistical analysis. (n = 12 per group). * at the top of each group's statistical graph indicates the difference analysis with the NS group. Data presented the mean ± SD (n = 6 per group, except for data G) (*P < 0.05, **P < 0.01, ***P < 0.001 and ns not significant)

