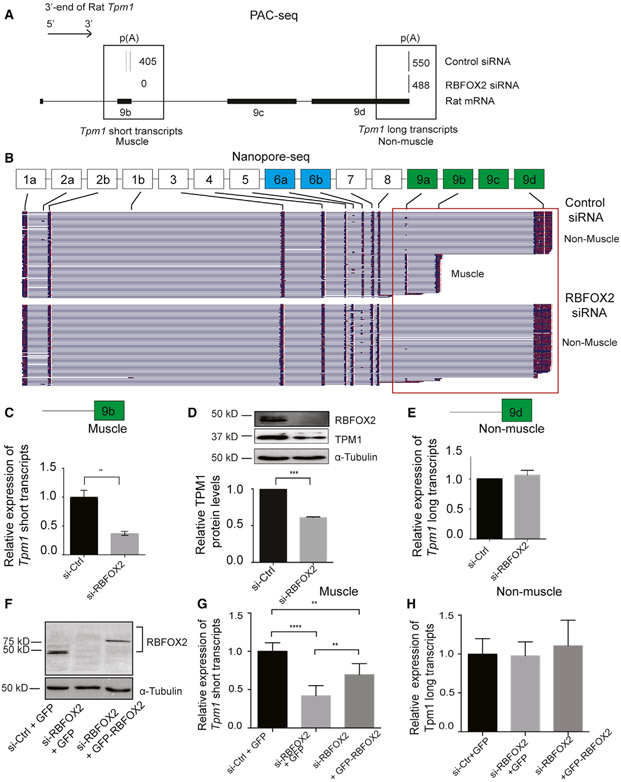
Figure 2. RBFOX2 regulates expression levels of muscle-specific isoforms of rat Tpm1 via splicing APA in H9c2 myoblasts.
(A) The poly(A) usage of Tpm1 transcripts in control and RBFOX2-depleted H9c2 cells determined by PAC-seq (n = 3). The number of reads mapped to Tpm1 transcripts was labeled within black boxes. PASs located in either TE 9b or TE 9d were utilized in H9c2 myoblasts.
(B) Full-length Tpm1 short (muscle) or long (non-muscle) isoforms identified by nanopore sequencing in control versus RBFOX2-depleted H9c2 myoblasts (n = 3). See also Figures S2 and S3
(C) Relative mRNA levels of Tpm1 muscle-specific (short) transcripts that end with exon 9b in control and RBFOX2-depleted H9c2 cells were determined by qRT-PCR. mRNA levels in control cells were normalized to 1. Data represent means ± SD. Statistical significance was calculated using t test to compare two different groups in three independent experiments (n = 3). **p = 0.0079.
(D) Relative protein levels of TPM1 in control and RBFOX2-depleted H9c2 cells determined by WB. α-tubulin was used as a loading control. Protein levels in control cells were normalized to 1. Data represent means ± SD. Statistical significance was calculated using t test to compare two different groups in three independent experiments (n = 3). ***p = 0.0001.
(E) Relative mRNA levels of Tpm1 non-muscle transcripts (long) in control and RBFOX2-depleted H9c2 cells. mRNA levels in control cells were normalized to 1. Data represent means ± SD. No statistical significance was found using t test in three independent experiments (n = 3).
(F) RBFOX2 protein expression levels in (1) scrambled-siRNA-treated, (2) RBFOX2-siRNA-treated, and (3) RBFOX2-siRNA-treated H9c2 cells ectopically expressing GFP or GFP-RBFOX2.
(G) Ectopic expression of GFP-RBFOX2 partially rescued splicing APA change in Tpm1 caused by RBFOX2 depletion. Relative expression levels of muscle-specific Tpm1 (short) transcripts in scrambled-siRNA-treated, RBFOX2-siRNA-treated, or RBFOX2-siRNA-treated H9c2 myoblasts expressing GFP or GFP-RBFOX2. mRNA levels in control cells (1) were normalized to 1. Data represent means ± SD. Statistical significance was calculated using one-way ANOVA to compare three different groups in three independent experiments (n = 3). p value for si-Ctrl-+GFP versus si-RBFOX2+GFP is ****p < 0.0001; for si-RBFOX2+ GFP versus si-RBFOX2+ GFP-RBFOX2 is **p = 0.0056; for si-Ctrl+GFP versus si-RBFOX2+ GFP-RBFOX2 is **p = 0.0027.
(H) Relative expression levels of non-muscle Tpm1 (long) transcripts in control, RBFOX2-depleted, or RBFOX2-depleted cells expressing GFP or GFP-RBFOX2. mRNA levels in (1) cells were normalized to 1. Data represent means ± SD. Statistical significance was calculated using one-way ANOVA to compare three different groups in three independent experiments (n = 3).

