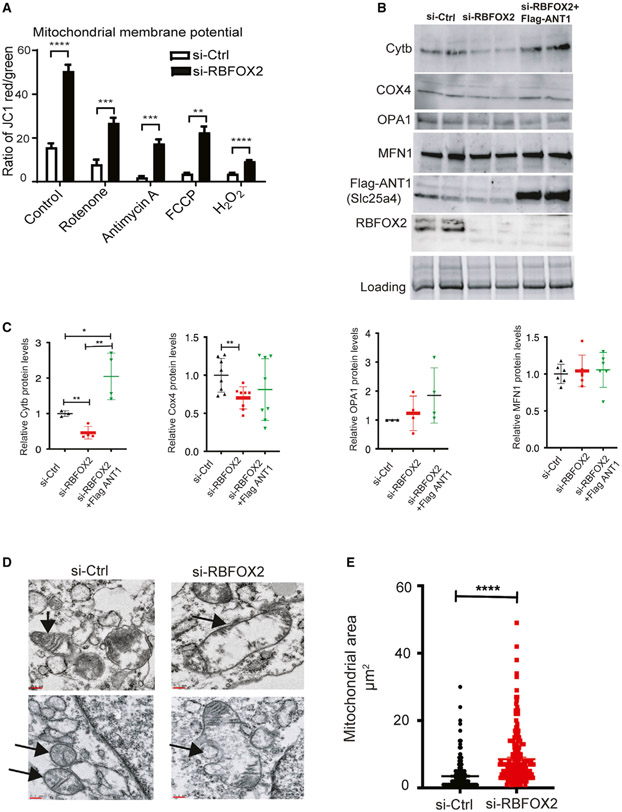
Figure 6. RBFOX2 depletion in H9c2 myoblasts affects mitochondrial gene expression and health.
(A) Mitochondrial membrane potential (Ψm) was determined by JC-1 staining of the H9c2 cells transfected with scrambled or Rbfox2 siRNA. Shown are the ratios of fluorescence intensity of J-aggregates (red fluorescence) to J-monomers (green fluorescence). Statistical significance was calculated using unpaired t test to compare two different groups in five replicates of two independent experiments. Data represent means ± SD. For mitochondrial membrane potential in untreated control versus RBFOX2-KD H9c2 cells, ****p < 0.0001; in control versus RBFOX2-KD H9c2 cells treated with rotenone, ***p = 0.0004; in control versus RBFOX2-KD H9c2 cells treated with antimycin A, ***p = 0.0009; in control versus RBFOX2-KD H9c2 cells treated with FCCP, **p = 0.0017; in control versus RBFOX2-KD H9c2 cells treated with H2O2, ****p < 0.0001.
(B) Representative WB images of mitochondrial proteins cytochrome b (Cytb), cytochrome c oxidase 4 (COX4) (n = 3 for control and n = 4 for RBFOX2 KD samples from three independent experiments), OPA1 (n = 3 for control and n = 4 for RBFOX2 KD samples from three independent experiments), and MFN1 (n = 6 for each group from three independent experiments) in control siRNA or RBFOX2-siRNA-treated cells expressing empty vector or FLAG-ANT1 (n ≥ 3, three independent experiments).
(C) Quantification of mitochondrial protein levels in control or RBFOX2 KD H9c2 cells expressing empty vector or FLAG-ANT1 plasmid with respect to their respective loading controls. COX4 si-Ctrl versus si-Rbfox2 **p = 0.0068, Cytb si-Ctrl versus si-Rbfox2 **p = 0.0046, si-Ctrl versus si-Rbfox2+ FLAG-ANT1 *p = 0.033, si-RBFOX2 versus si-Rbfox2 +FLAG-ANT1 **p = 0.0020.
(D) Representative transmission electron microscopy images of mitochondria in control versus RBFOX2-KD H9c2 cells. Black arrows mark the mitochondria. n = 3 (three independent experiments). Scale bar: 0.1 micron.
(E) Surface area of mitochondria in control and RBFOX2-depleted myoblasts was calculated using ImageJ. n = 234 mitochondria for control, n = 216 mitochondria for RBFOX2 KD myoblasts from three independent KD experiments, ****p < 0.0001.

