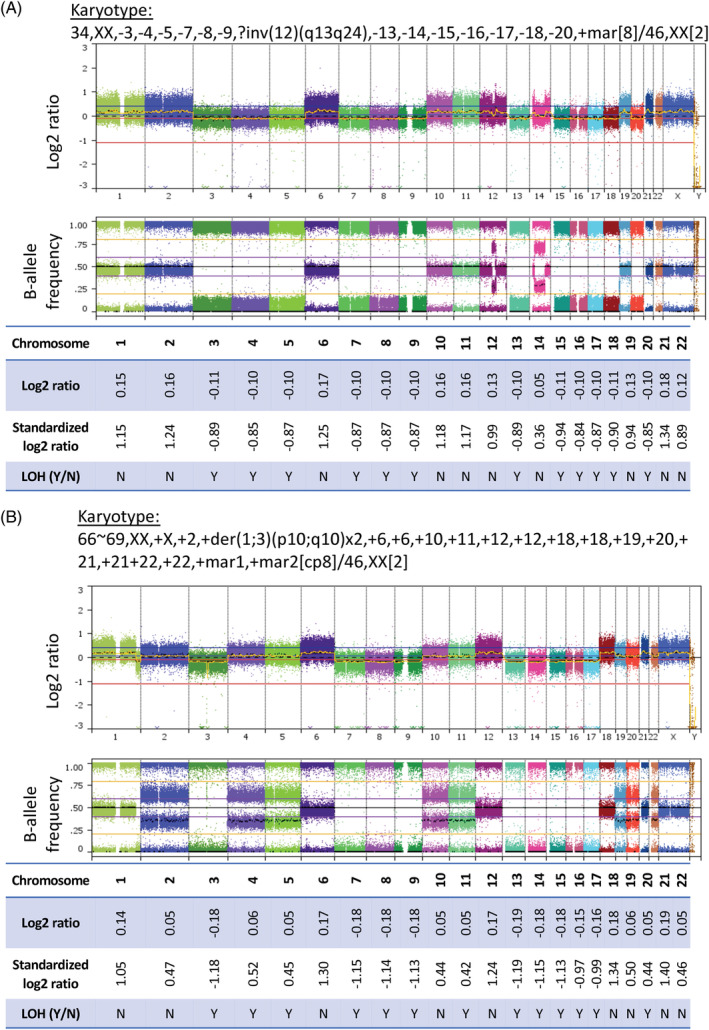
FIGURE 2.

Single‐nucleotide polymorphism (SNP) arrays of low hypodiploid (A) and near triploid cases (B) (whole genome view of SNP arrays and whole chromosome log2 ratios, shown to 2 decimal places). (A) Example of a low hypodiploid case (#27069, blast percentage 96%) where only a low hypodiploid clone was detected on karyotype. Reduced log2 ratios are seen in chromosomes with complete loss of heterozygosity (LOH) on B‐allele frequency trace (LOH‐lower copy number [LCN]) and elevated log2 ratios in chromosomes with preserved disomic pattern of SNPs on B‐allele frequency. (B) Example case (#25437, blast percentage 88%) where only a near triploid clone was detected on karyotype. Reduced log2 ratios are seen in chromosomes with complete LOH on B‐allele frequency trace (LOH‐LCN) and elevated log2 ratios in chromosomes without LOH
