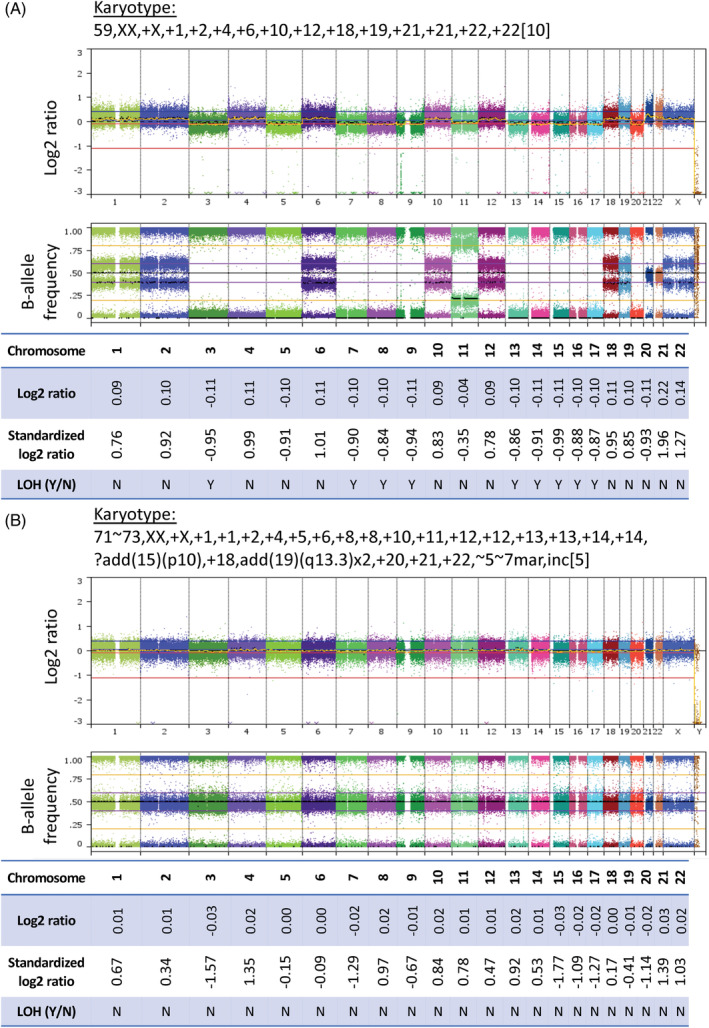
FIGURE 3.

Single‐nucleotide polymorphism (SNP) arrays of cytogenetically misclassified (A) and visually inconclusive (B) cases (whole genome view of SNP arrays and whole chromosome log2 ratios, shown to 2 decimal places). (A) Example case (#27478, blast percentage 88%) cytogenetically classified as high hyperdiploidy with conflicting SNP array profile. SNP array demonstrates complete loss of heterozygosity (LOH) of chromosomes with the lowest copy number state (LOH‐lower copy number [LCN]). Other chromosomes show a trisomic complement of SNPs. Overall, the pattern observed is similar to that seen in hypodiploid/near triploid (HoTr) cases, contradicting initial cytogenetic subgroup despite modal chromosome number. (B) Example near triploid case (#28056, blast percentage 90%) with an inconclusive SNP array. The appearances would typically be associated with non‐leukaemic DNA contamination, although blast percentage in the diagnostic sample was high. The karyotype contains five tetrasomies and a duplicated structural abnormality consistent with HoTr. Although the log2 ratio and B‐allele frequency traces appear almost normal, the whole chromosome log2 ratio of chromosomes 3, 7, 15, 16, 17, 19, and 20 (which are frequently monosomic in low hypodiplody) is reduced. When standardized, whole chromosome log2 ratios correctly clustered with the HoTr cases (Figure 4)
