
Figure 8.
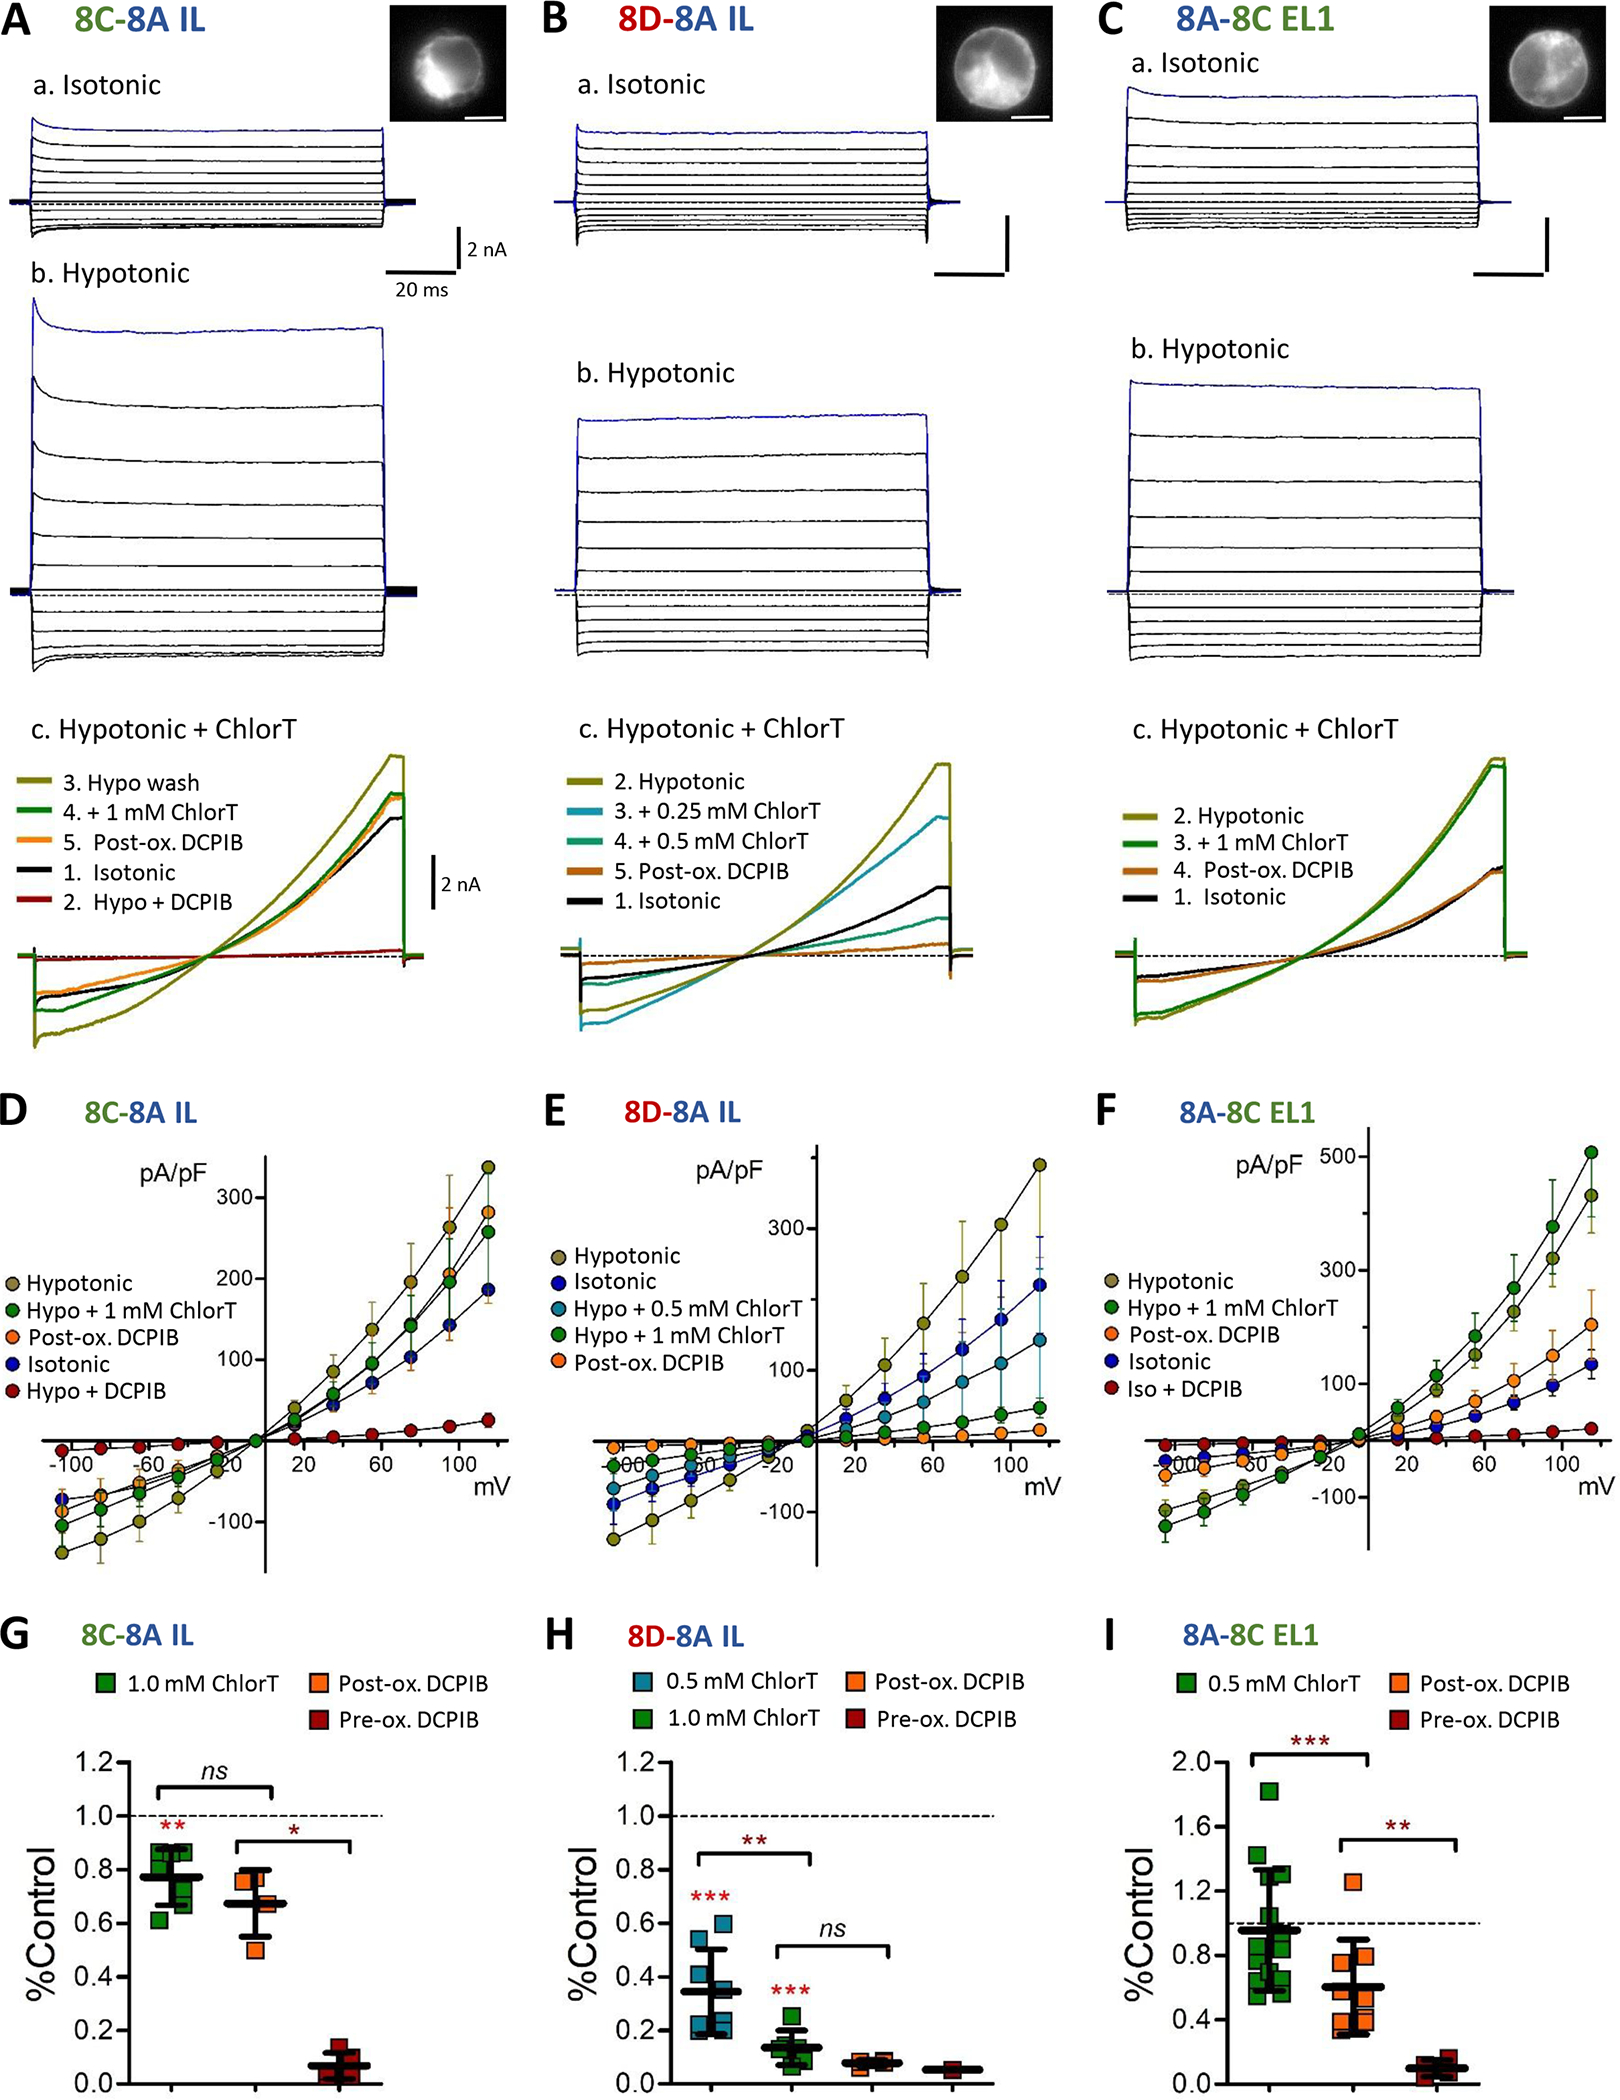
Differential oxidant sensitivity of LRRC8C, 8D and 8A currents. The 8A intracellular loop (IL) was substituted onto the 8C (A, 8C-8A-IL) and 8D (B, 8D-8A-IL) constructs tagged with mGFP or mCh and expressed in LRRC8A(−/−) cells. Inset images (a) show construct fluorescence in the recorded cell. Panels a–b: Representative currents evoked by 100 ms voltage pulses (−100 to +120 mV) under isotonic (a) and hypotonic conditions (b). Scale: 2 nA, 20 ms (A-C). Panel c: Current responses in individual cells elicited by 250 ms voltage ramps (−100 to +120 mV) under the indicated series of conditions (isotonic, hypotonic, hypotonic + ChlorT, DCPIB). 8C-8A IL current is weakly inhibited by ChlorT (Ac), while 8D-8A IL current (Bc) is strongly inhibited in a concentration-dependent manner by 0.25 mM and 0.5 mM ChlorT. C, The first extracellular loop (EL1) of 8C was substituted onto LRRC8A-mGFP (8A-8C EL1). Expressing cells display currents in both isotonic and hypotonic conditions (a,b). 8A-8C EL1 current is unaffected by 1 mM ChlorT (c). D–F, I-V relationships for the three expression conditions, showing mean current densities (S.E.M.) at each voltage level under the indicated conditions. G-I, Quantified inhibitory effects of ChlorT (0.5 – 1.0 mM) and DCPIB (pre- and post-oxidant exposure). Horizontal brackets compare the indicated pair of bars (Paired ratio t-test or Mann-Whitney test). 1 mM ChlorT weakly inhibits 8C-8A IL currents (G)) by 23% (**P = 0.0024 vs. control; n = 7), but potently inhibits 8D-8A IL currents (H) by >85% (***P = 0.0001 vs. control; P = 0.0012 vs. 8C-8A IL). ChlorT exerts no overall effect on 8A-8C EL1 current amplitudes (I) (P = 0.2837 vs. control; n = 14). Post-ox. DCPIB exposure results in insignificant additional current block for 8C (P = 0.1949; n = 5) and 8D (P = 0.067; n = 4), and 40% additional block for 8A-8C EL1 (P = 0.0028; n = 9).
Cell images 30um×30um 20% orig cropped size 10um scale bar
IV traces 75% orig
Ramp traces 75%
IV plots 77%