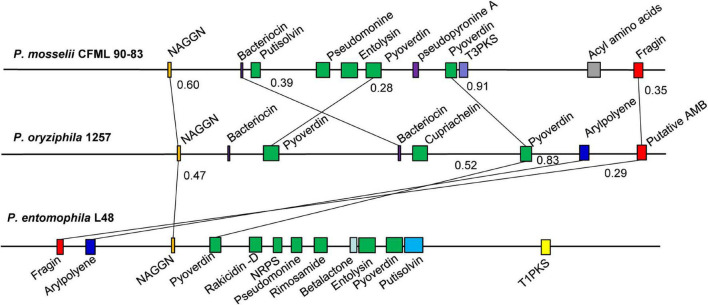
FIGURE 3.
Comparison of the secondary metabolite biosynthesis gene clusters of P. oryziphila1257 with P. entomophila L48 and P. mosselii CFML 90-83. The number on the horizontal line represented the Jaccard index. Colinear regions are connected by black lines. NAGGN, N-acetylglutaminylglutamine amide; T3PKS, type III PKS; T1PKS, type I PKS (polyketide synthase); NRPS, non-ribosomal peptide synthetase cluster; AMB, L-2-amino-4-methoxy-trans-3-butenoic acid.

