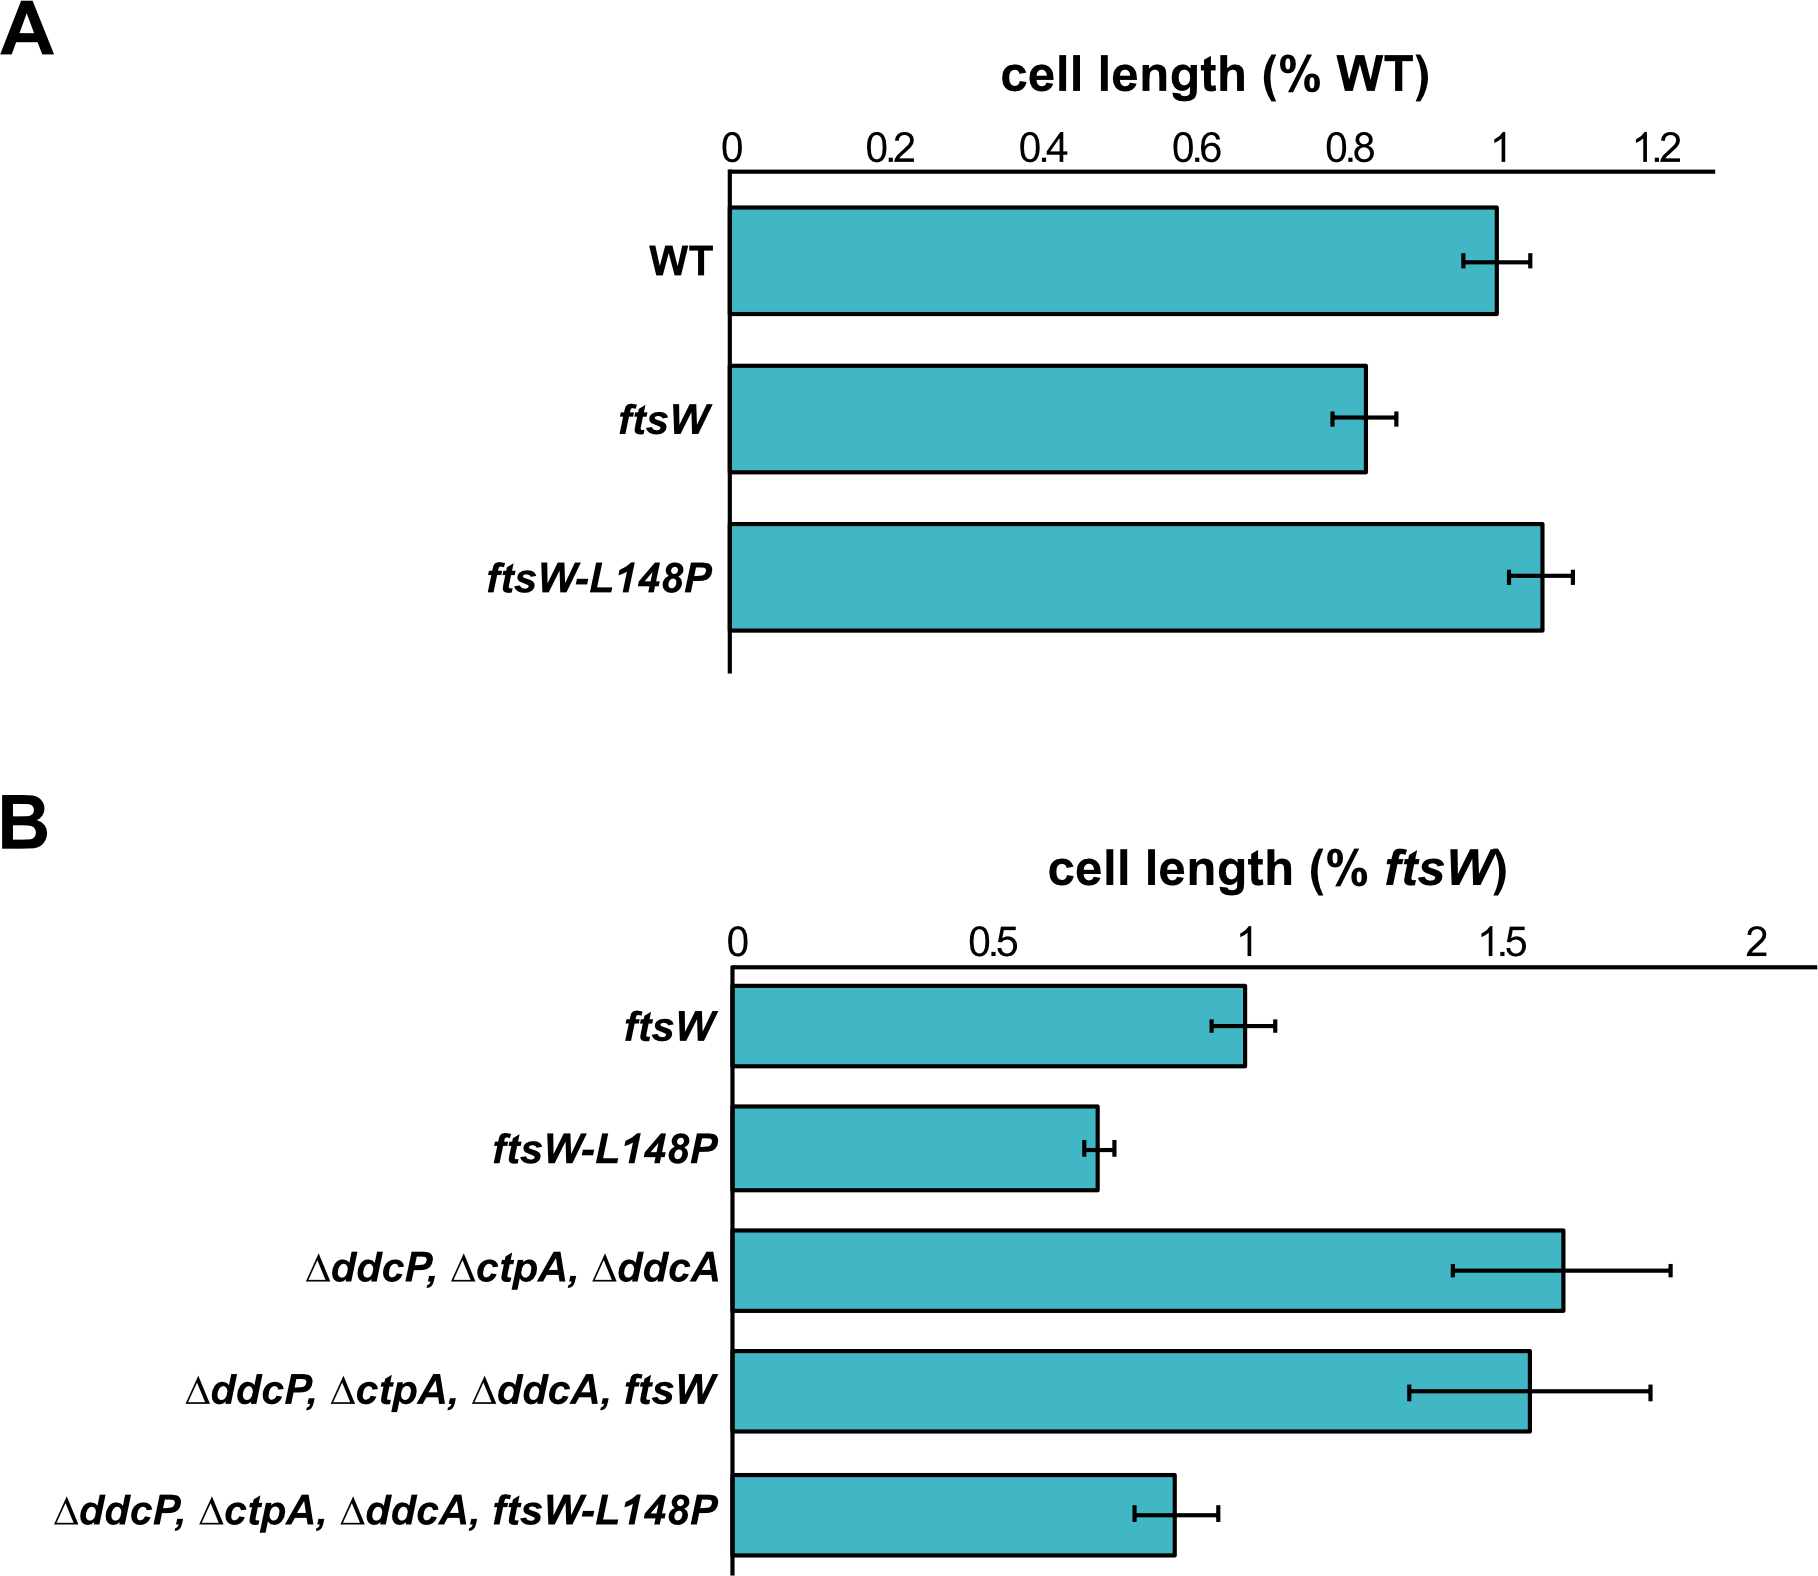
Figure 5. ftsW-L148P bypasses yneA expression.

(A) Cell lengths of each strain relative to WT plotted as a bar graph. Error bars represent standard error of the mean (SEM). The significance test are as follows for a two-tailed t-test: PY79 and amyE::Phy-ftsW (p=0.988); PY79 and amyE::Phy-ftsW-L148P (p=0.959). (B) Cell lengths of each strain relative to ftsW plotted as a bar graph. Error bars represent standard error of the mean (SEM). The significance test are as follows for a two-tailed t-test. For amyE::Phy-ftsW and amyE::Phy-ftsW-L148P (p=4.71E−300); amyE::Phy-ftsW and ΔddcP, ΔctpA, ΔddcA (p=5.14E−119); amyE::Phy-ftsW and ΔddcP, ΔctpA, ΔddcA, amyE::Phy-ftsW-L148P (p=2.6E−36). The cell length measurements graphed here are also presented in supporting Tables S2 and S3.
