Figure 3.
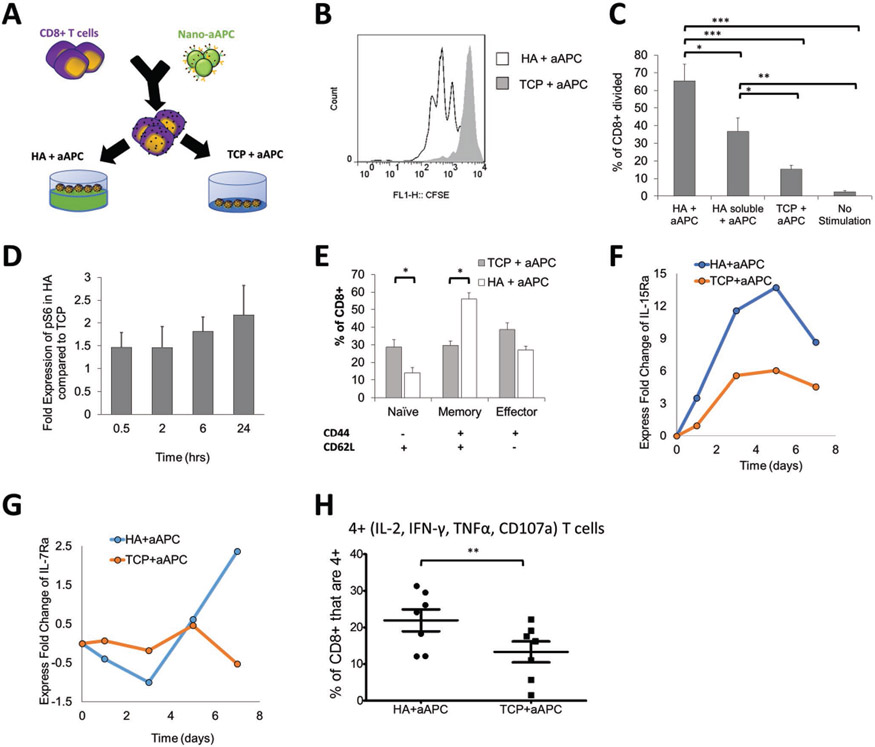
Stimulated T cells are influenced by additional signaling from the HA hydrogel. A) Schematic showing experimental setup testing the difference between activating antigen-specific CD8+ T cells with nanoparticle artificial antigens presenting cells (aAPC) on HA hydrogel versus a tissue culture plate (TCP). B) CFSE proliferation dye dilution measured after 3 d of stimulation of antigen-specific T cells stimulated by the same dose of aAPC on either TCP or on HA hydrogel surface. C) Percent of CD8+ T cells that have divided by day 3 as measured by CFSE proliferation dye dilution (error bars show s.e.m., *p < 0.05, **p < 0.005, ***p < 0.0005 n = 7, one-way ANOVA with Tukey’s post-test). D) Time course experiment using p-S6 (S240/S244) as the read out for mTORC1 activation. This relative fold-change pattern represents three independent experiments using phospho-flow cytometry. E) Phenotypic markers (CD62L, CD44) measured by flow cytometry after 7 d of stimulation with aAPC on different surfaces (error bars show s.e.m.; *p < 0.05, n = 7, Student’s t-test, two-tailed). F,G) Time course experiment detecting fold change of F) IL15Ra (CD215) and G) IL7Ra (CD127). Geometric means of each data point are compared first with their isotype controls followed by the baseline control. Data represents two independent experiments. H) T cells positive for all four cytokine and functional molecules (IL-2, IFN-γ, TNFα, CD107a) were measured by flow cytometry after 7 d of stimulation (error bars show s.e.m.; *p < 0.05, n = 7, Paired t-test, two-tailed).

