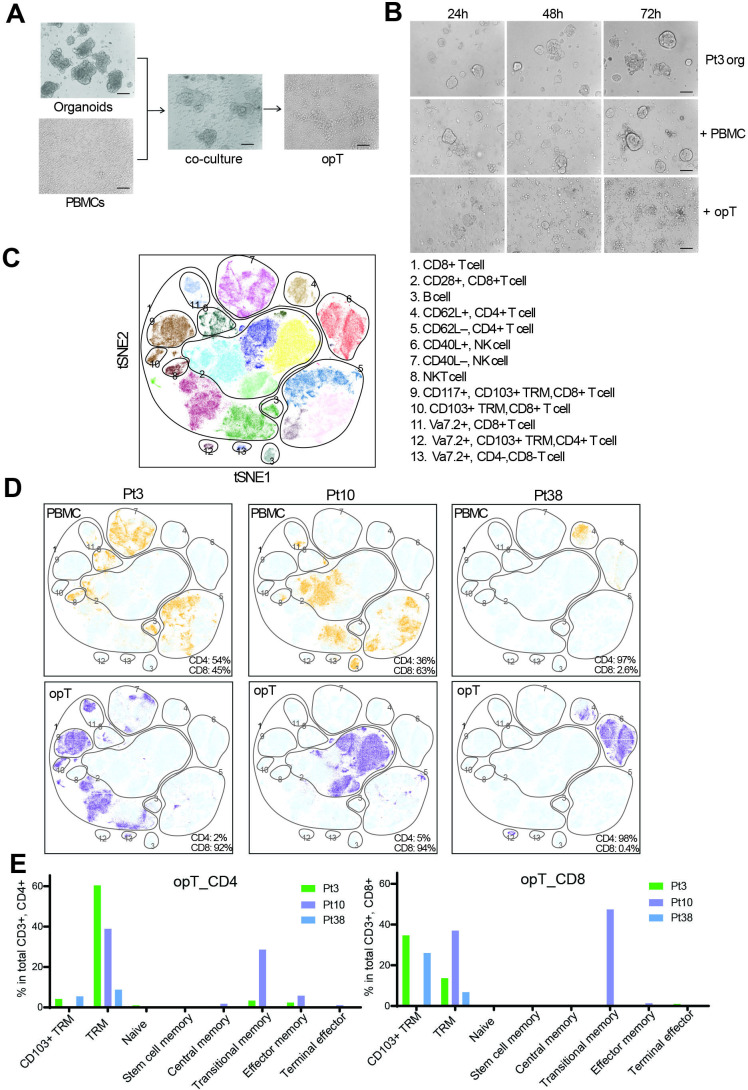
Figure 1.
Generation and characterization of tumor-targeting cytotoxic T cells using autologous tumor organoids. (A) Patient tumor organoids co-cultured with autologous PBMC for 14 days for generation of organoid-primed T (opT) cells. Scale bar, 100 µm. (B) Representative phase-contrast images for Pt3 tumor organoids alone or co-culture with autologous PBMC or opT at different time points to demonstrate cell killing. Scale bar, 100 µm. (C) t-SNE plot showing all possible clusters detectable by CyTOF analysis of the six samples. The CyTOF clusters were assembled into 13 phenotypic groups for interpretation. (D) Comparison of PBMC (yellow) and opT (purple) cells for the presence of CyTOF clusters against the background of all possible clusters (light blue). The percentage of CD4 +and CD8+ cells within the CD3 + population is shown in the bottom right. (E) Phenotypes in CD4 + or CD8+ opT cell populations grouped per marker expression. See online supplemental table S2A for the makers used to define the phenotypes. CyTOF, cytometry by time-of-flight; h, hours; NK, natural killer; PBMCs, peripheral blood mononuclear cells; Pt, patient; TRM, tissue-resident memory; t-SNE, t-distributed Stochastic Neighbor Embedding.

