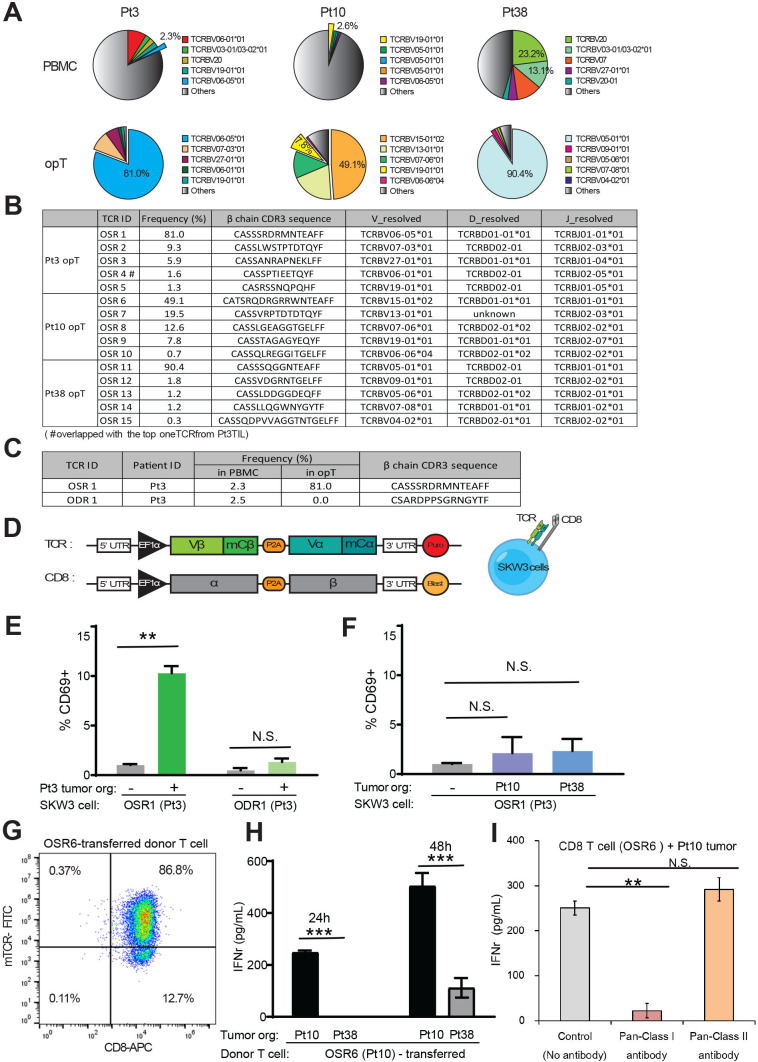
Figure 4.
Clonal expansion in opT cells and identification of TCR. (A) Pie-charts showing representation of a given TCR beta-chain as a percentage of the all the independent TCRs detected. (B) Frequencies and CDR3 beta-chain sequences for the top five organoid-selected TCR (OSR) from each patient. (C) TCR enriched in Pt3 opT and organoid-depleted TCR (ODR1) used for generation of recombinant TCR. (D) A schematic of chimeric TCR that comprised of human Vα and Vβ chains and mouse constant α and β chains and co-expressed with human CD8 gene in SKW-3 cells. (E) Expression of T cell activation marker (CD69) in TCR-expressing SKW-3 cells exposed to autologous (Pt3) tumor organoids. N.S., not significant. **, p<0.01. P value calculated using two-tailed, unpaired t-test. (F) Expression of CD69 in OSR1 expressing SKW-3 cells exposed to allogenic (Pt10 and Pt38) tumor organoids. N.S., not significant. (G) CD8 + T cells from a donor PBMC were transduced with the chimeric TCR (OSR6) and flow sorted by mouse-TCR chimera (mTCR-FITC) expression. (H) OSR6 expressing CD8 + T cells were exposed to autologous (Pt10) or allogenic (Pt38) organoids and media analyzed for IFN-γ by ELISA. ***, p<0.001. P value calculated using two-tailed, unpaired t-test. (I) OSR6 expressing CD8 + T cells were exposed to autologous (Pt10) organoids with either Pan-MHC Class I antibody (W6/32) or Pan-MHC Class II antibody (Tu39) and media analyzed for IFN-γ by ELISA. N.S., not significant. **, p<0.01. P value calculated using two-tailed, unpaired t-test. IFN, interferon; opT, organoid-primed T; PBMCs, peripheral blood mononuclear cells; Pt, patient; TCR, T cell receptor.

