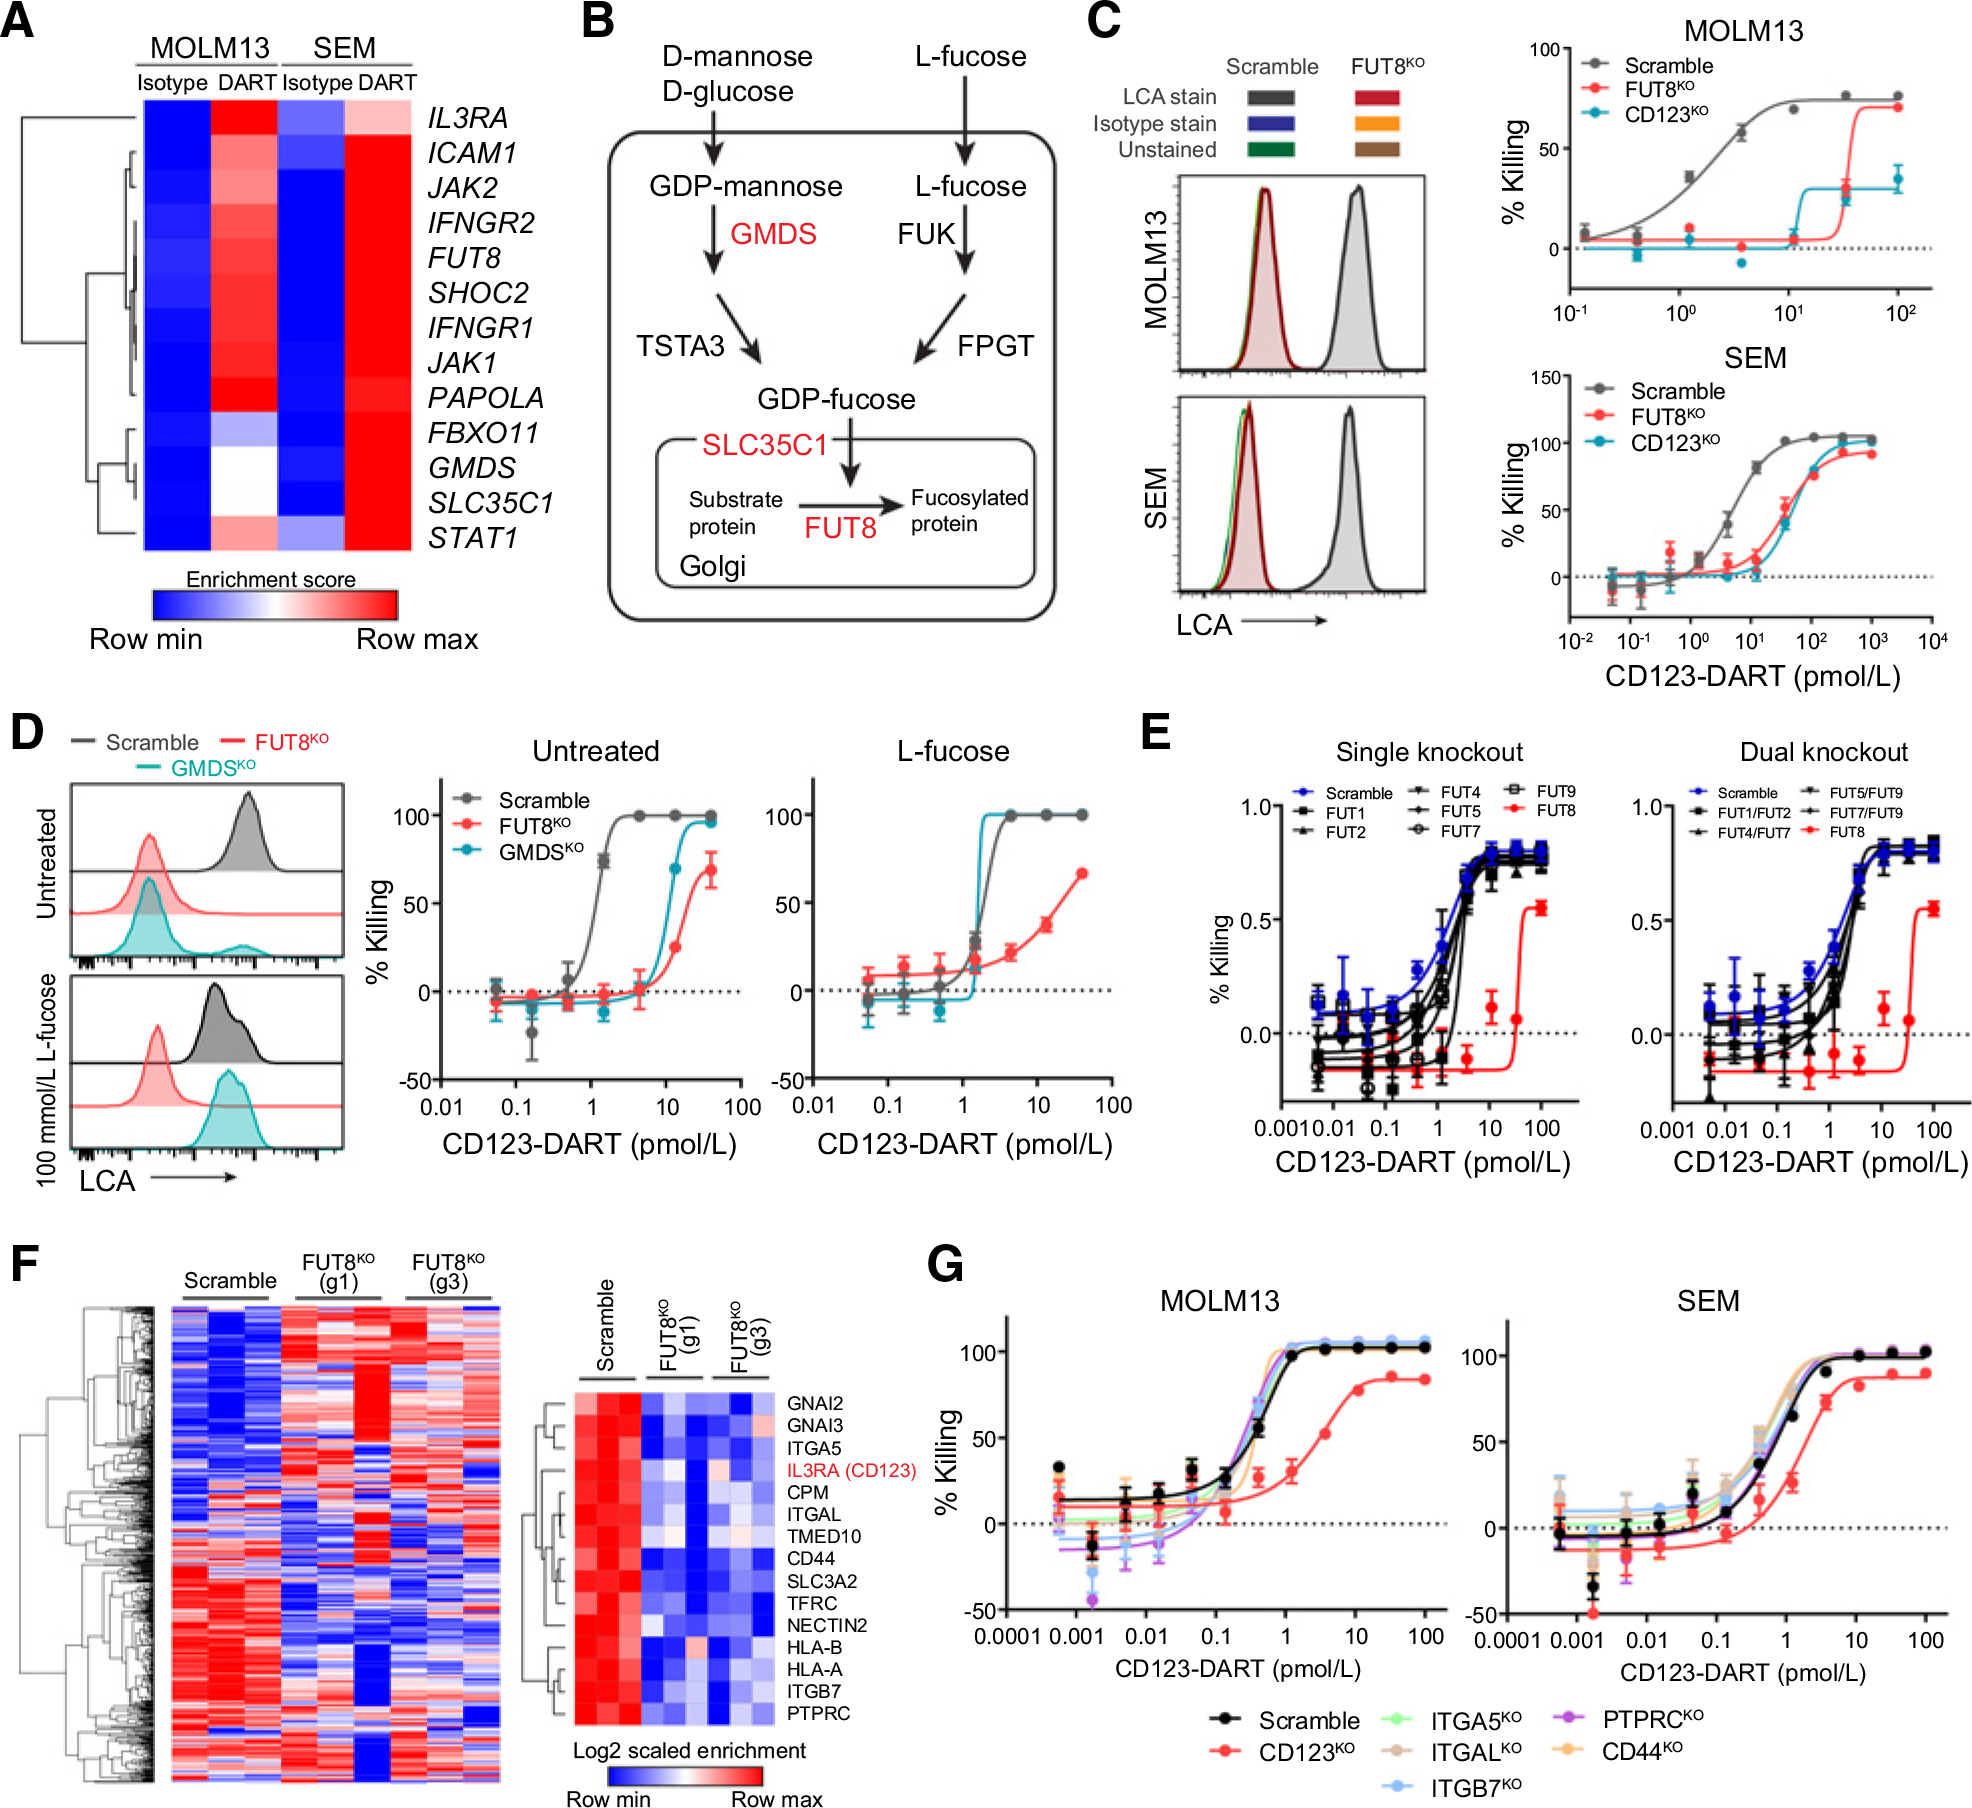
Figure 3.

Deficiency in the core fucosylation pathway constitutes a novel resistance mechanism to CD123-DART treatment. A, Heatmap showing the enrichment scores of the shared hits from the MOLM13 and SEM CRISPR screen. DART represents CD123-DART. B, Depiction of the core fucosylation pathway. The hits from the screens are highlighted in red. C, RTCC assay of FUT8KO and CD123KO cells with CD123-DART treatment (n = 4). The RTCC assay used T-cell:target cell ratio of 1:1, and target cell killing was measured 72 hours after treatment. Knockout of FUT8 was confirmed by the loss of LCA staining (left plots). Data represent two independent experiments. The isotype antibody staining and unstained groups overlapped with the histogram of FUT8KO cells. D, Scramble, FUT8KO, and GMDSKO cells were cultured in media supplemented with 100 mmol/L L-fucose, and core fucosylation was measured by LCA staining (left plots). The cells were then applied to the RTCC assay using CD123-DART (n = 4). The RTCC assay used T-cell:target cell ratio of 1:1, and target cell killing was measured 72 hours after treatment. E, RTCC assay (n = 4) of MOLM13 cells with single fucosyltransferase knockout (left plot) or dual fucosyltransferase knockout (right plot) compared with the killing of the FUT8KO group (shown in red; n = 3). The RTCC assay used T-cell:target cell ratio of 1:1, and target cell killing was measured 72 hours after treatment. F, Quantification of core fucosylated proteins by LCA pulldown in concatenation with mass spectrometry (n = 3). Cell-surface proteins with significant enrichment (see Materials and Methods; Supplementary Table S5) in the Scramble group are listed (right plot). G, RTCC assay (n = 4) of MOLM13 cells with knockout of selected genes from the protein list in F. The RTCC assay used T-cell:target cell ratio of 1:1, and target cell killing was measured 72 hours after treatment. For each plot, error bars represent SEM.
