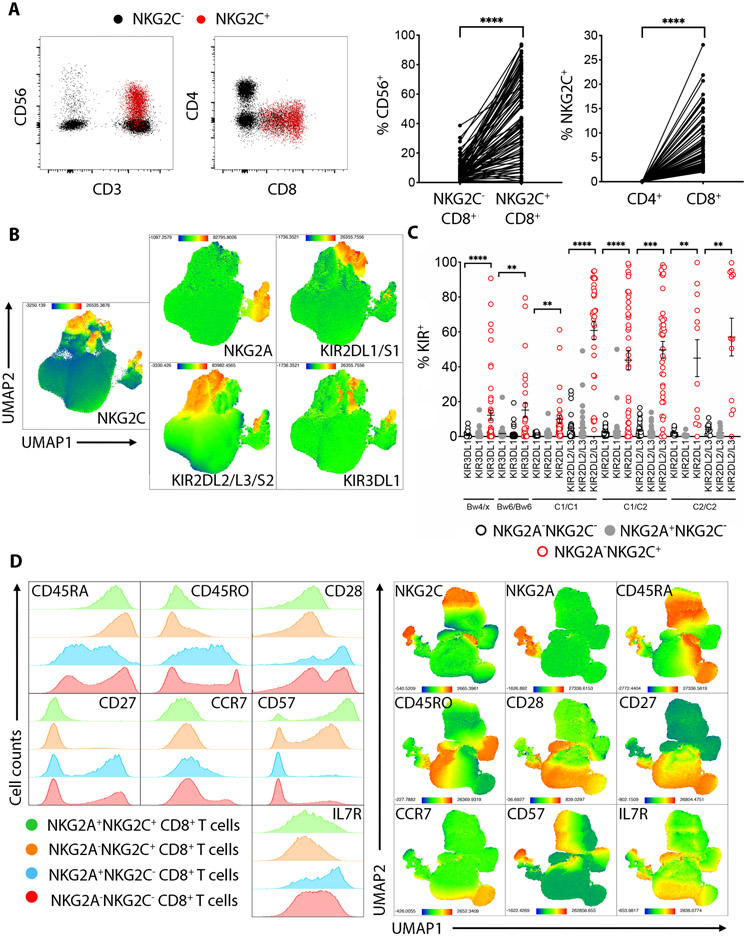
Fig. 2. Phenotype of NKG2C+CD8+ T cells.
(A) Dot plots showing CD56, CD4 and CD8 expression on NKG2C+CD8+ T cells (red) or NKG2C−CD8+ T cells (black). Graphs on the right show cumulative analysis from 88 donors. Statistical significance was calculated using paired student-t test. (B) UMAP plots showing the cumulative expression of NKG2C, NKG2A and KIR receptors in total CD8+ T cells from 88 donors. (C) Graph showing the frequency of NKG2C+CD8+ T cells expressing the indicated KIR receptors compared to NKG2C−CD8+ T cells or NKG2A+CD8+ T cells, segregated by donor-expressed KIR ligands HLA-C1, -C2, -Bw4 and Bw6. Statistical analysis was performed by student-t test comparing the NKG2C−CD8+ or the NKG2A+CD8+ vs NKG2C+CD8+ for each KIR within the indicated HLA haplotype. (D) Left: FACS histograms show staining of the indicated markers in one representative individual. Right: UMAP plots show the expression of the indicated markers in total CD8+ T cells, cumulative of 6 different individuals. ** P-value < 0.01, *** P-value < 0.001, **** P-value < 0.0001.

