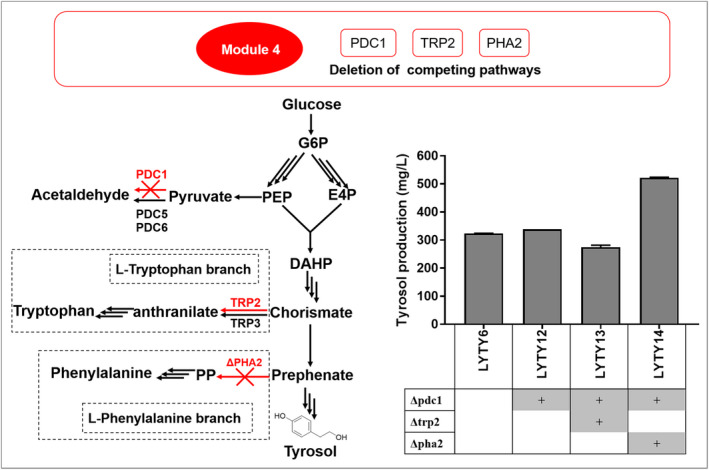
Fig. 3.

Effect of PDC1, PHA2 and TRP2 deletion on tyrosol production. The left schematic represents the competing pathways. The right pane represents the tyrosol production of the modified strains. Titre of tyrosol was produced after 72 h fermentation in 50 ml YPD medium. Error bars represented the standard deviation from three replicates.
