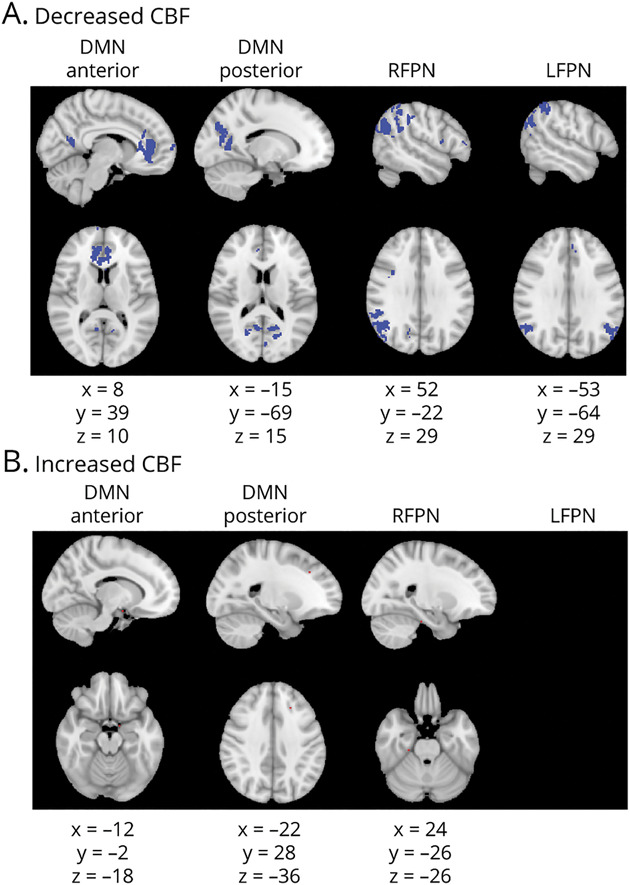
Figure 4. CBF Changes in Cognitively Impaired Compared to Cognitively Preserved Patients Based on a Voxelwise Analysis of CBF Maps.

Figure shows voxels showing cerebral blood flow (CBF) abnormalities in red. Columns show each of the resting-state networks compared. First row (A) shows areas of decreased CBF (in blue). Second row (B) shows areas of increased CBF (in red). Montreal Neurological Institute coordinates are given for the biggest voxel clusters displayed. Results were threshold-free cluster enhancement corrected at p ≤ 0.05, 2 sided. DMN = default mode network; LFPN = left frontoparietal network; RFPN = right frontoparietal network.
