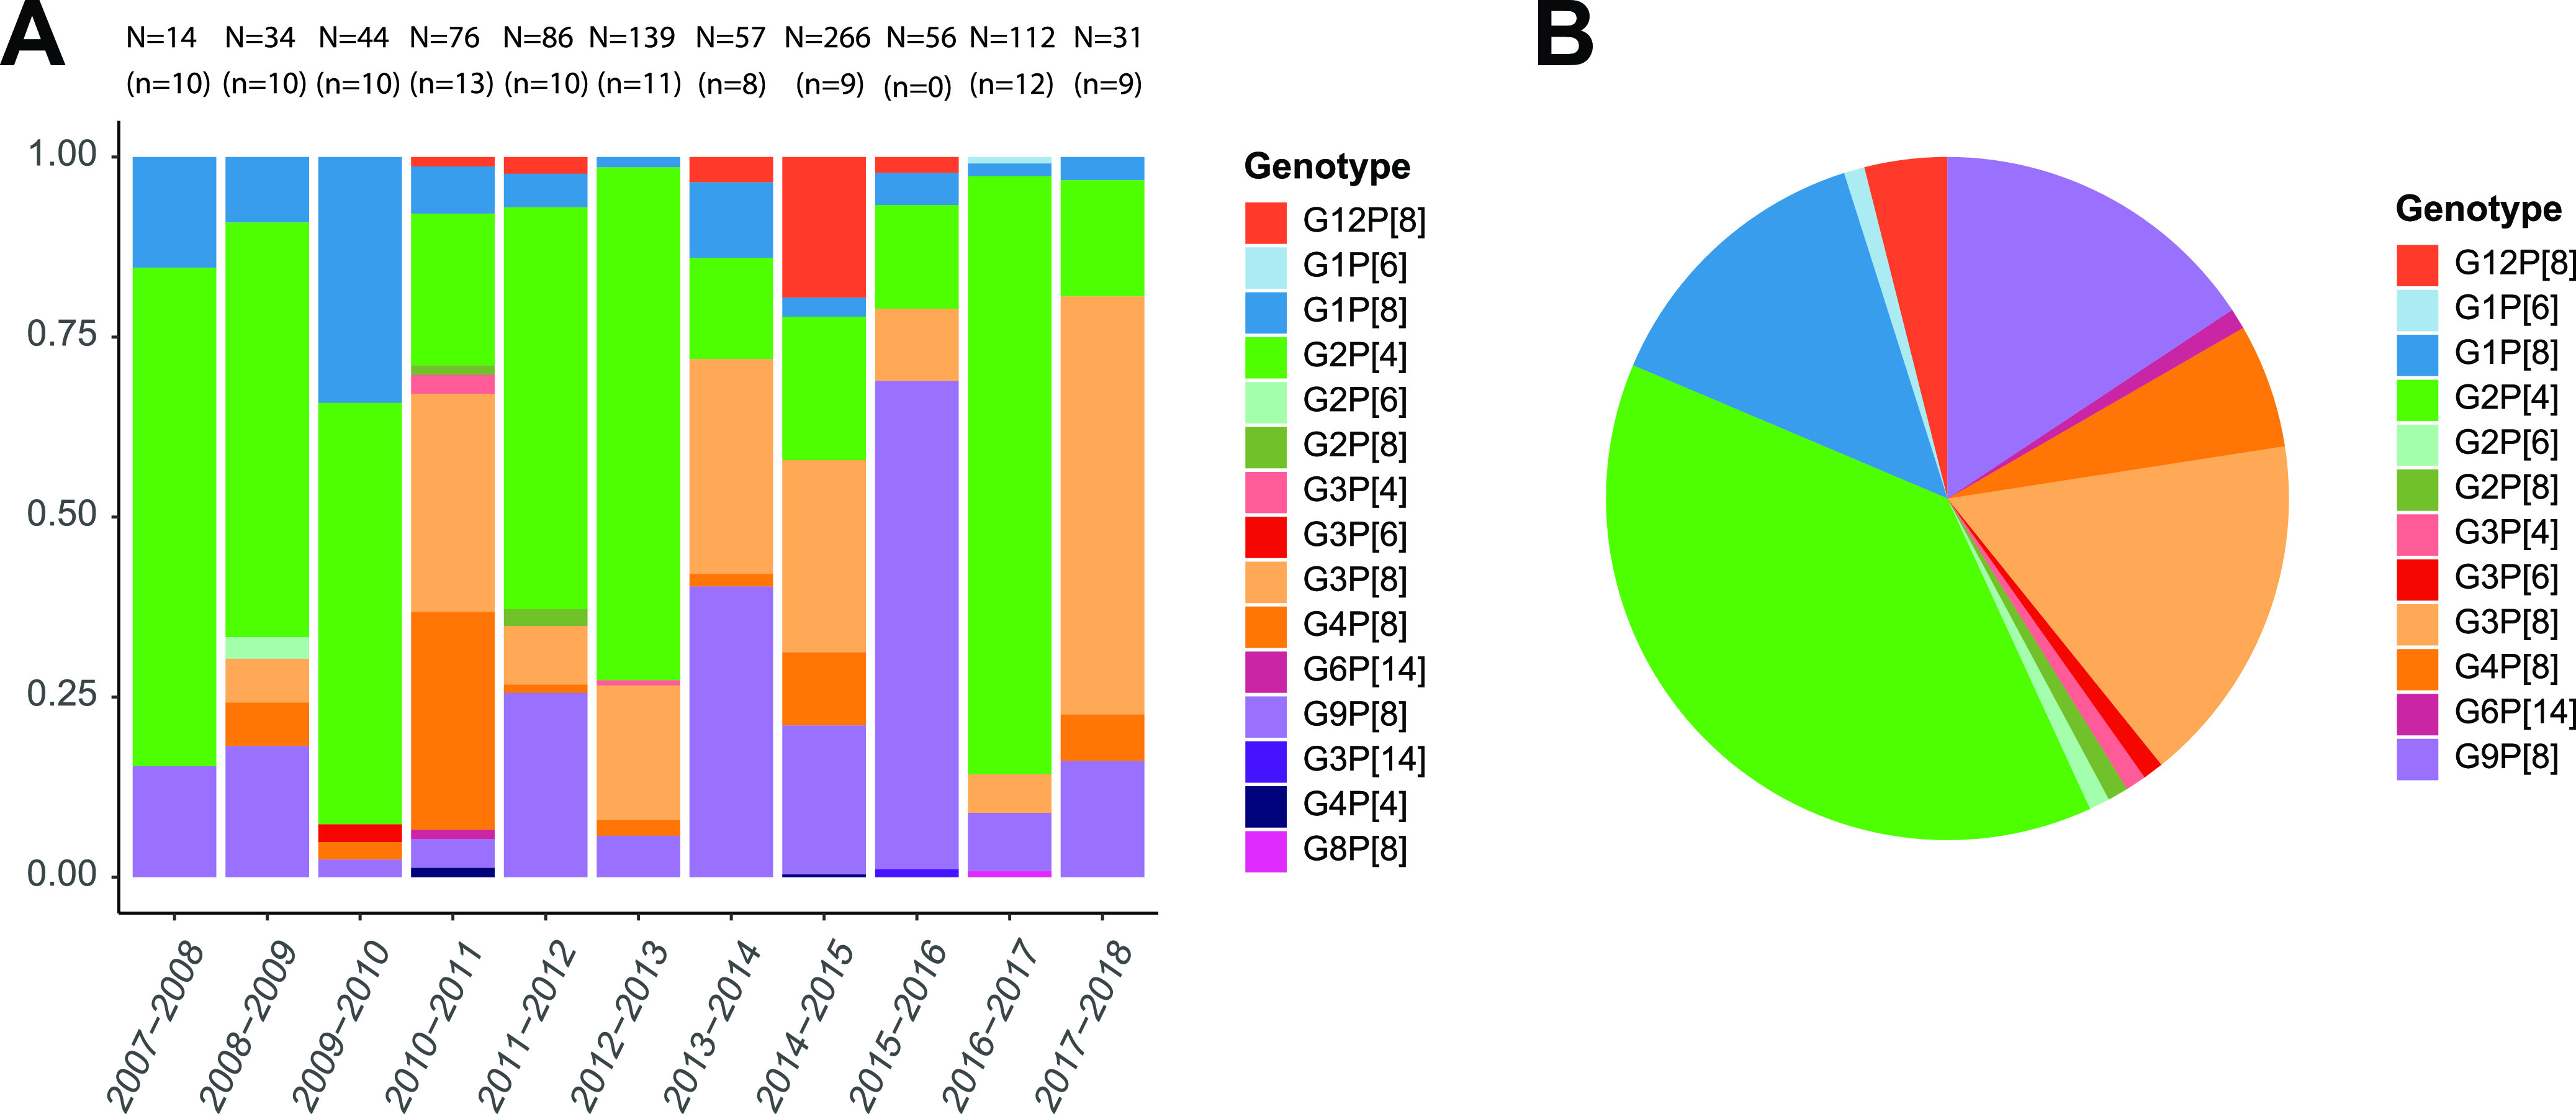
FIG 1.

G/P-genotype distribution of the rotavirus vaccine breakthrough strains collected between 2007 and 2018 (postvaccination period). (A) Relative proportions of the rotavirus genotypes per season for all known vaccine breakthrough cases (n = 915), with the absolute numbers of cases (N) and the selected number of cases (n) indicated above each bar. (B) Genotype distribution of the 102 samples selected for further analyses.
