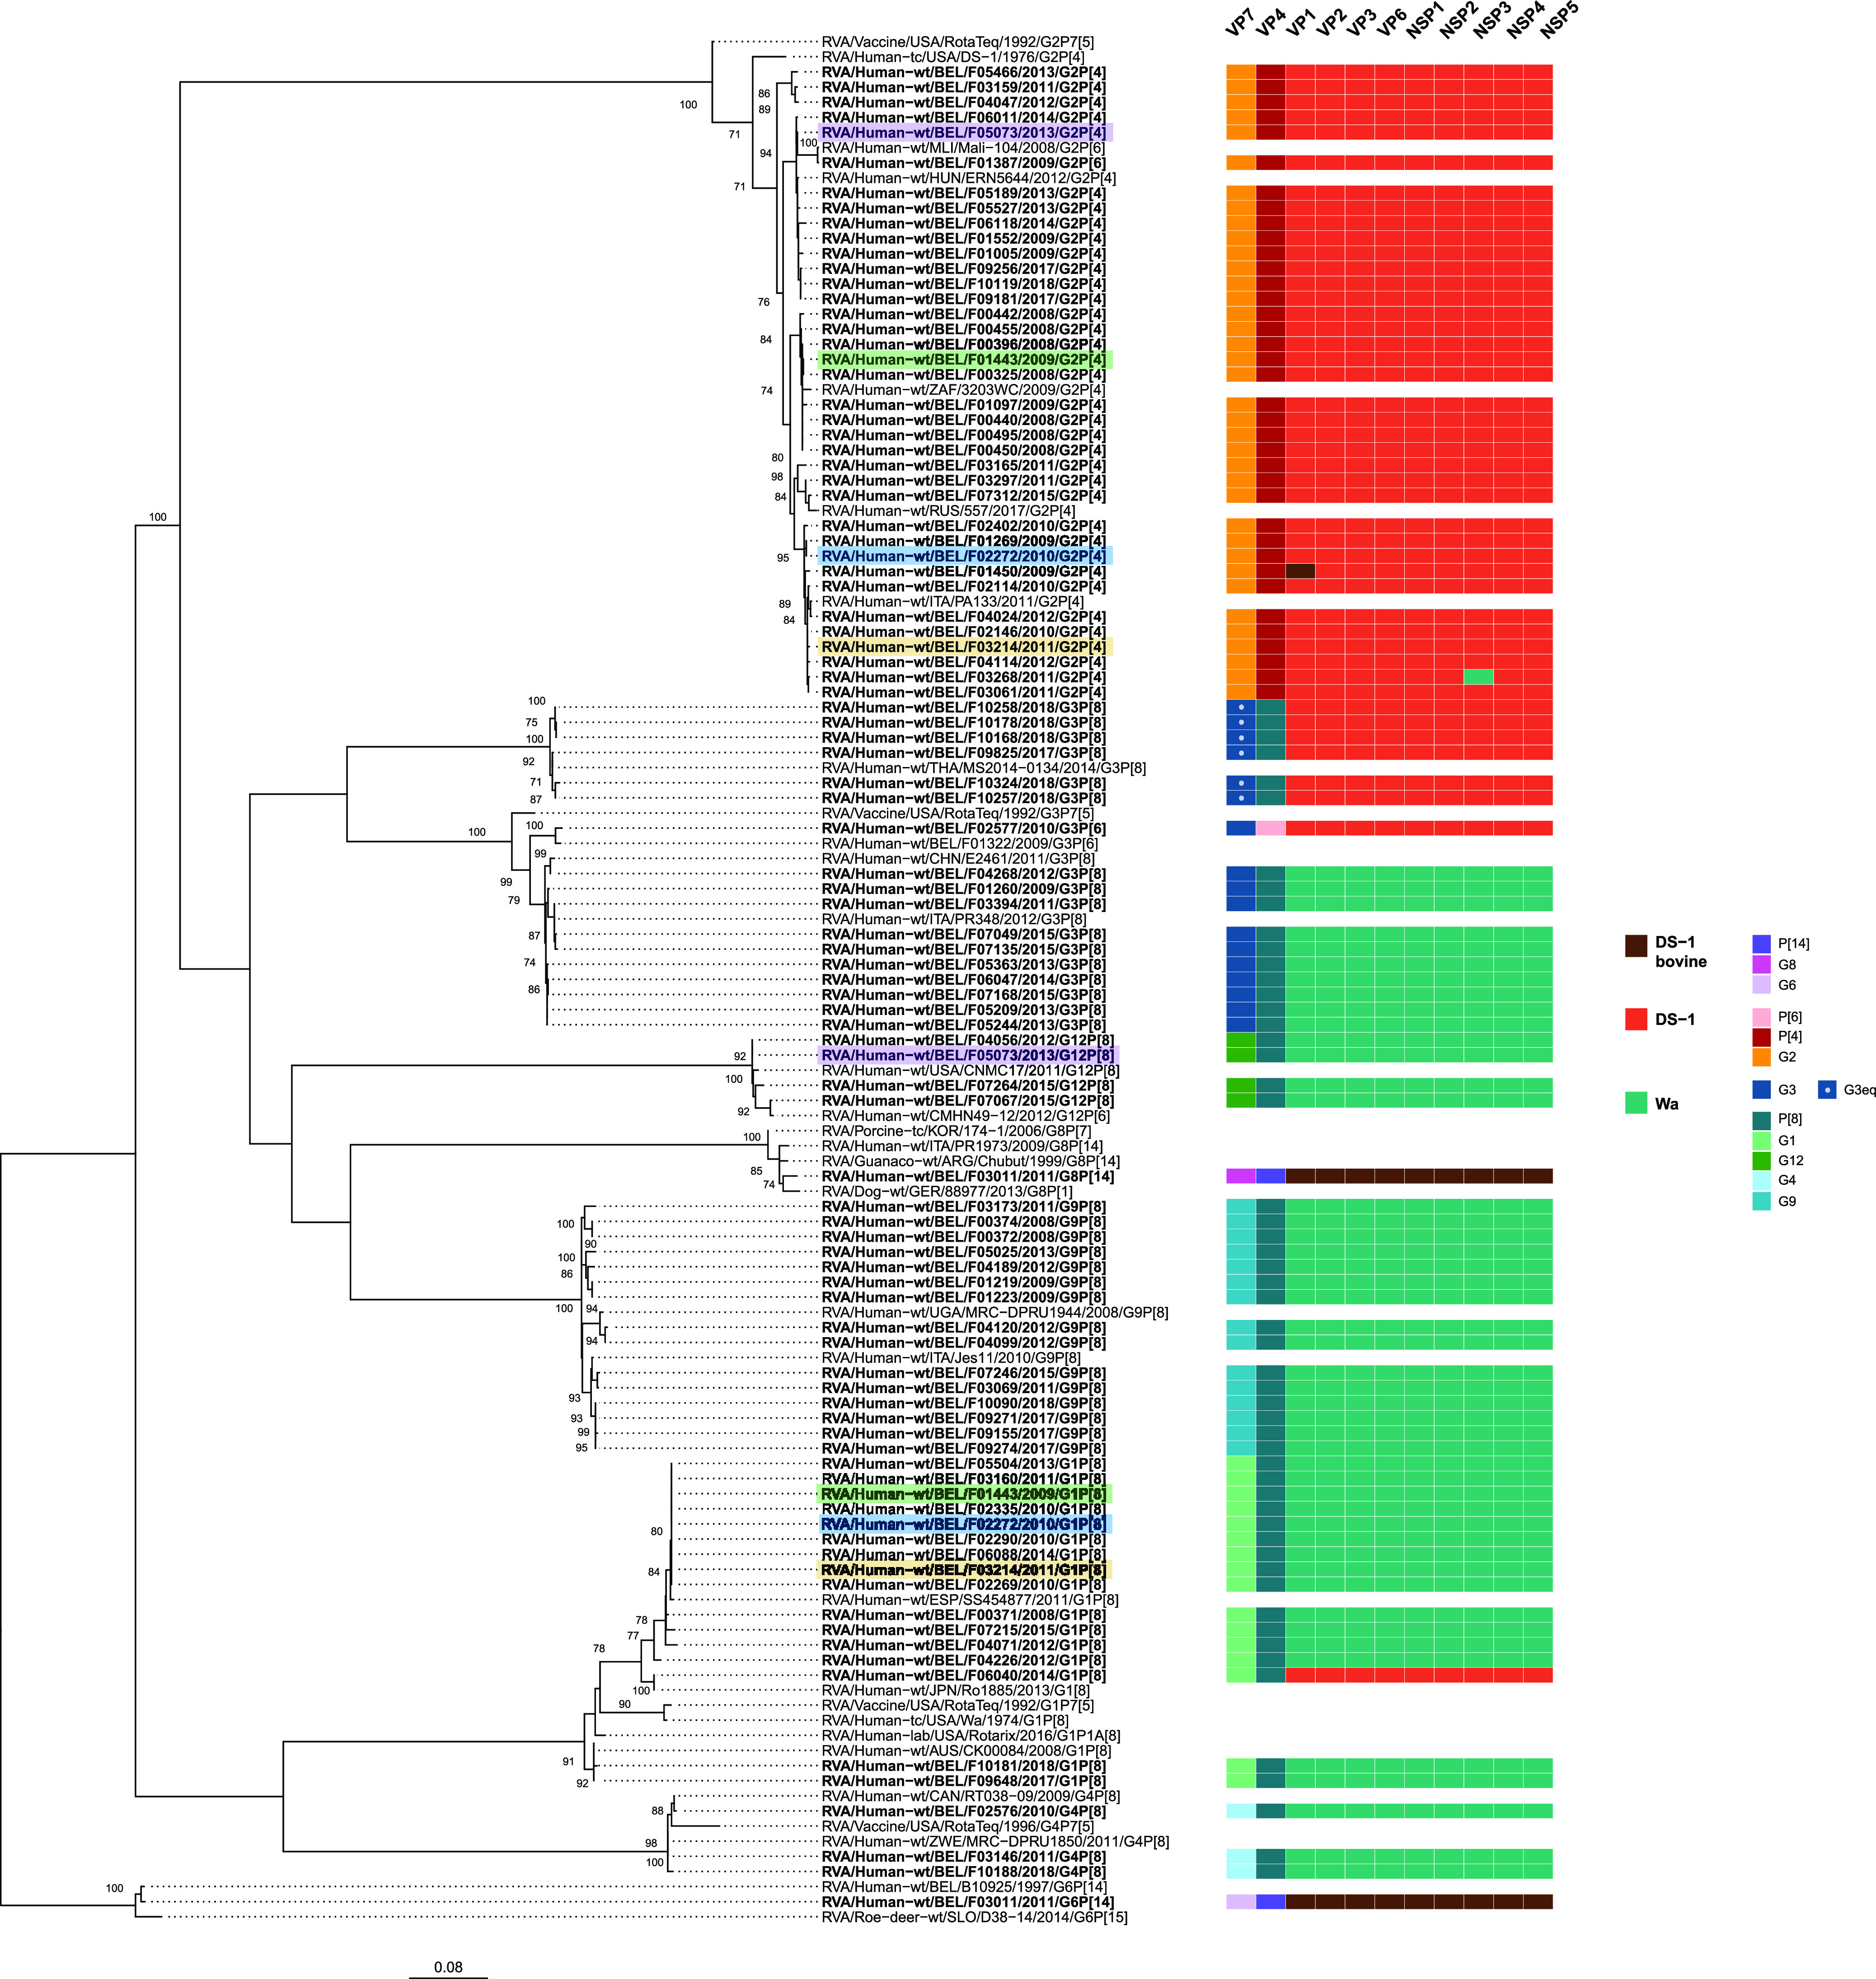
FIG 3.

Maximum-likelihood tree of the VP7 gene of the detected rotavirus sequences (in boldface) with reference rotavirus genomes. The genotype constellations of the detected strains are shown on the right. Samples harboring multiple genotype constellations (rotavirus coinfections) are highlighted. Only the bootstrap values above 70% are shown. The branch lengths are drawn to scale and represent the nucleotide substitutions per site.
