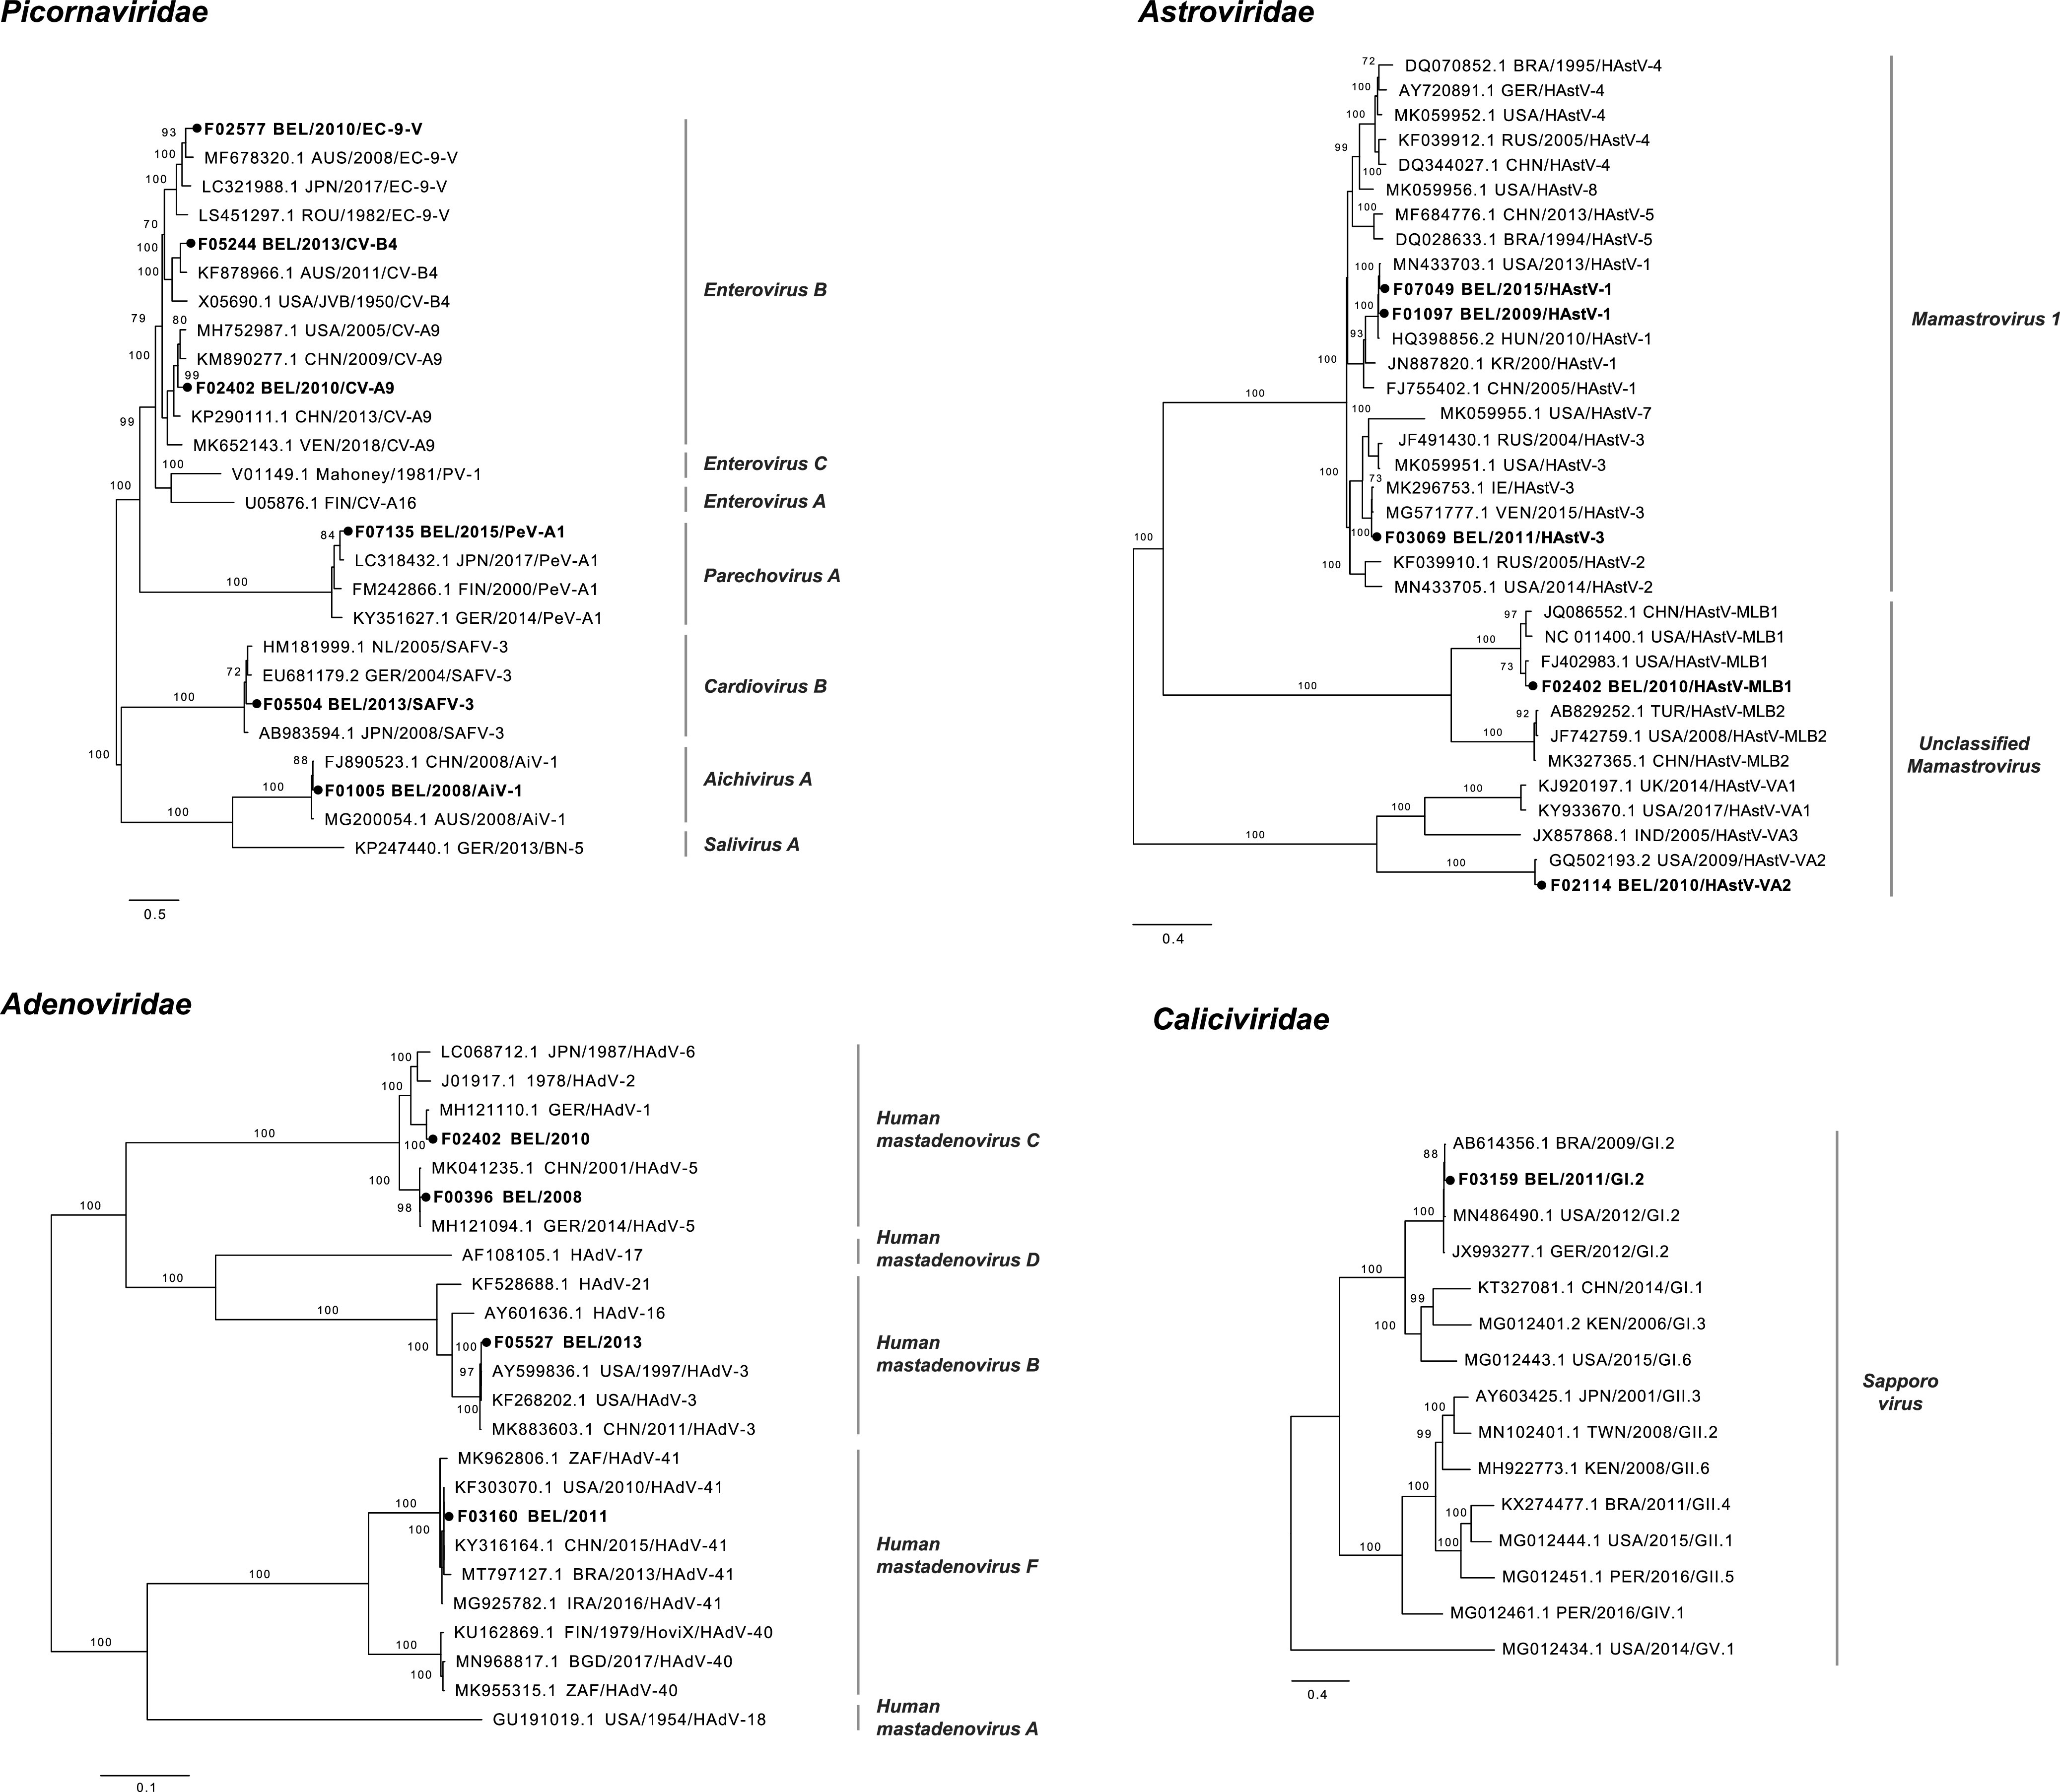
FIG 4.

Maximum likelihood trees of the complete genomes of picornaviruses, astroviruses, adenoviruses, and sapoviruses. The strains identified in this study are indicated with boldface type and dark circles. The species are shown next to the branches. Only bootstrap values above 70% are shown. The branch lengths are drawn to scale and represent the number of nucleotide substitutions per site.
