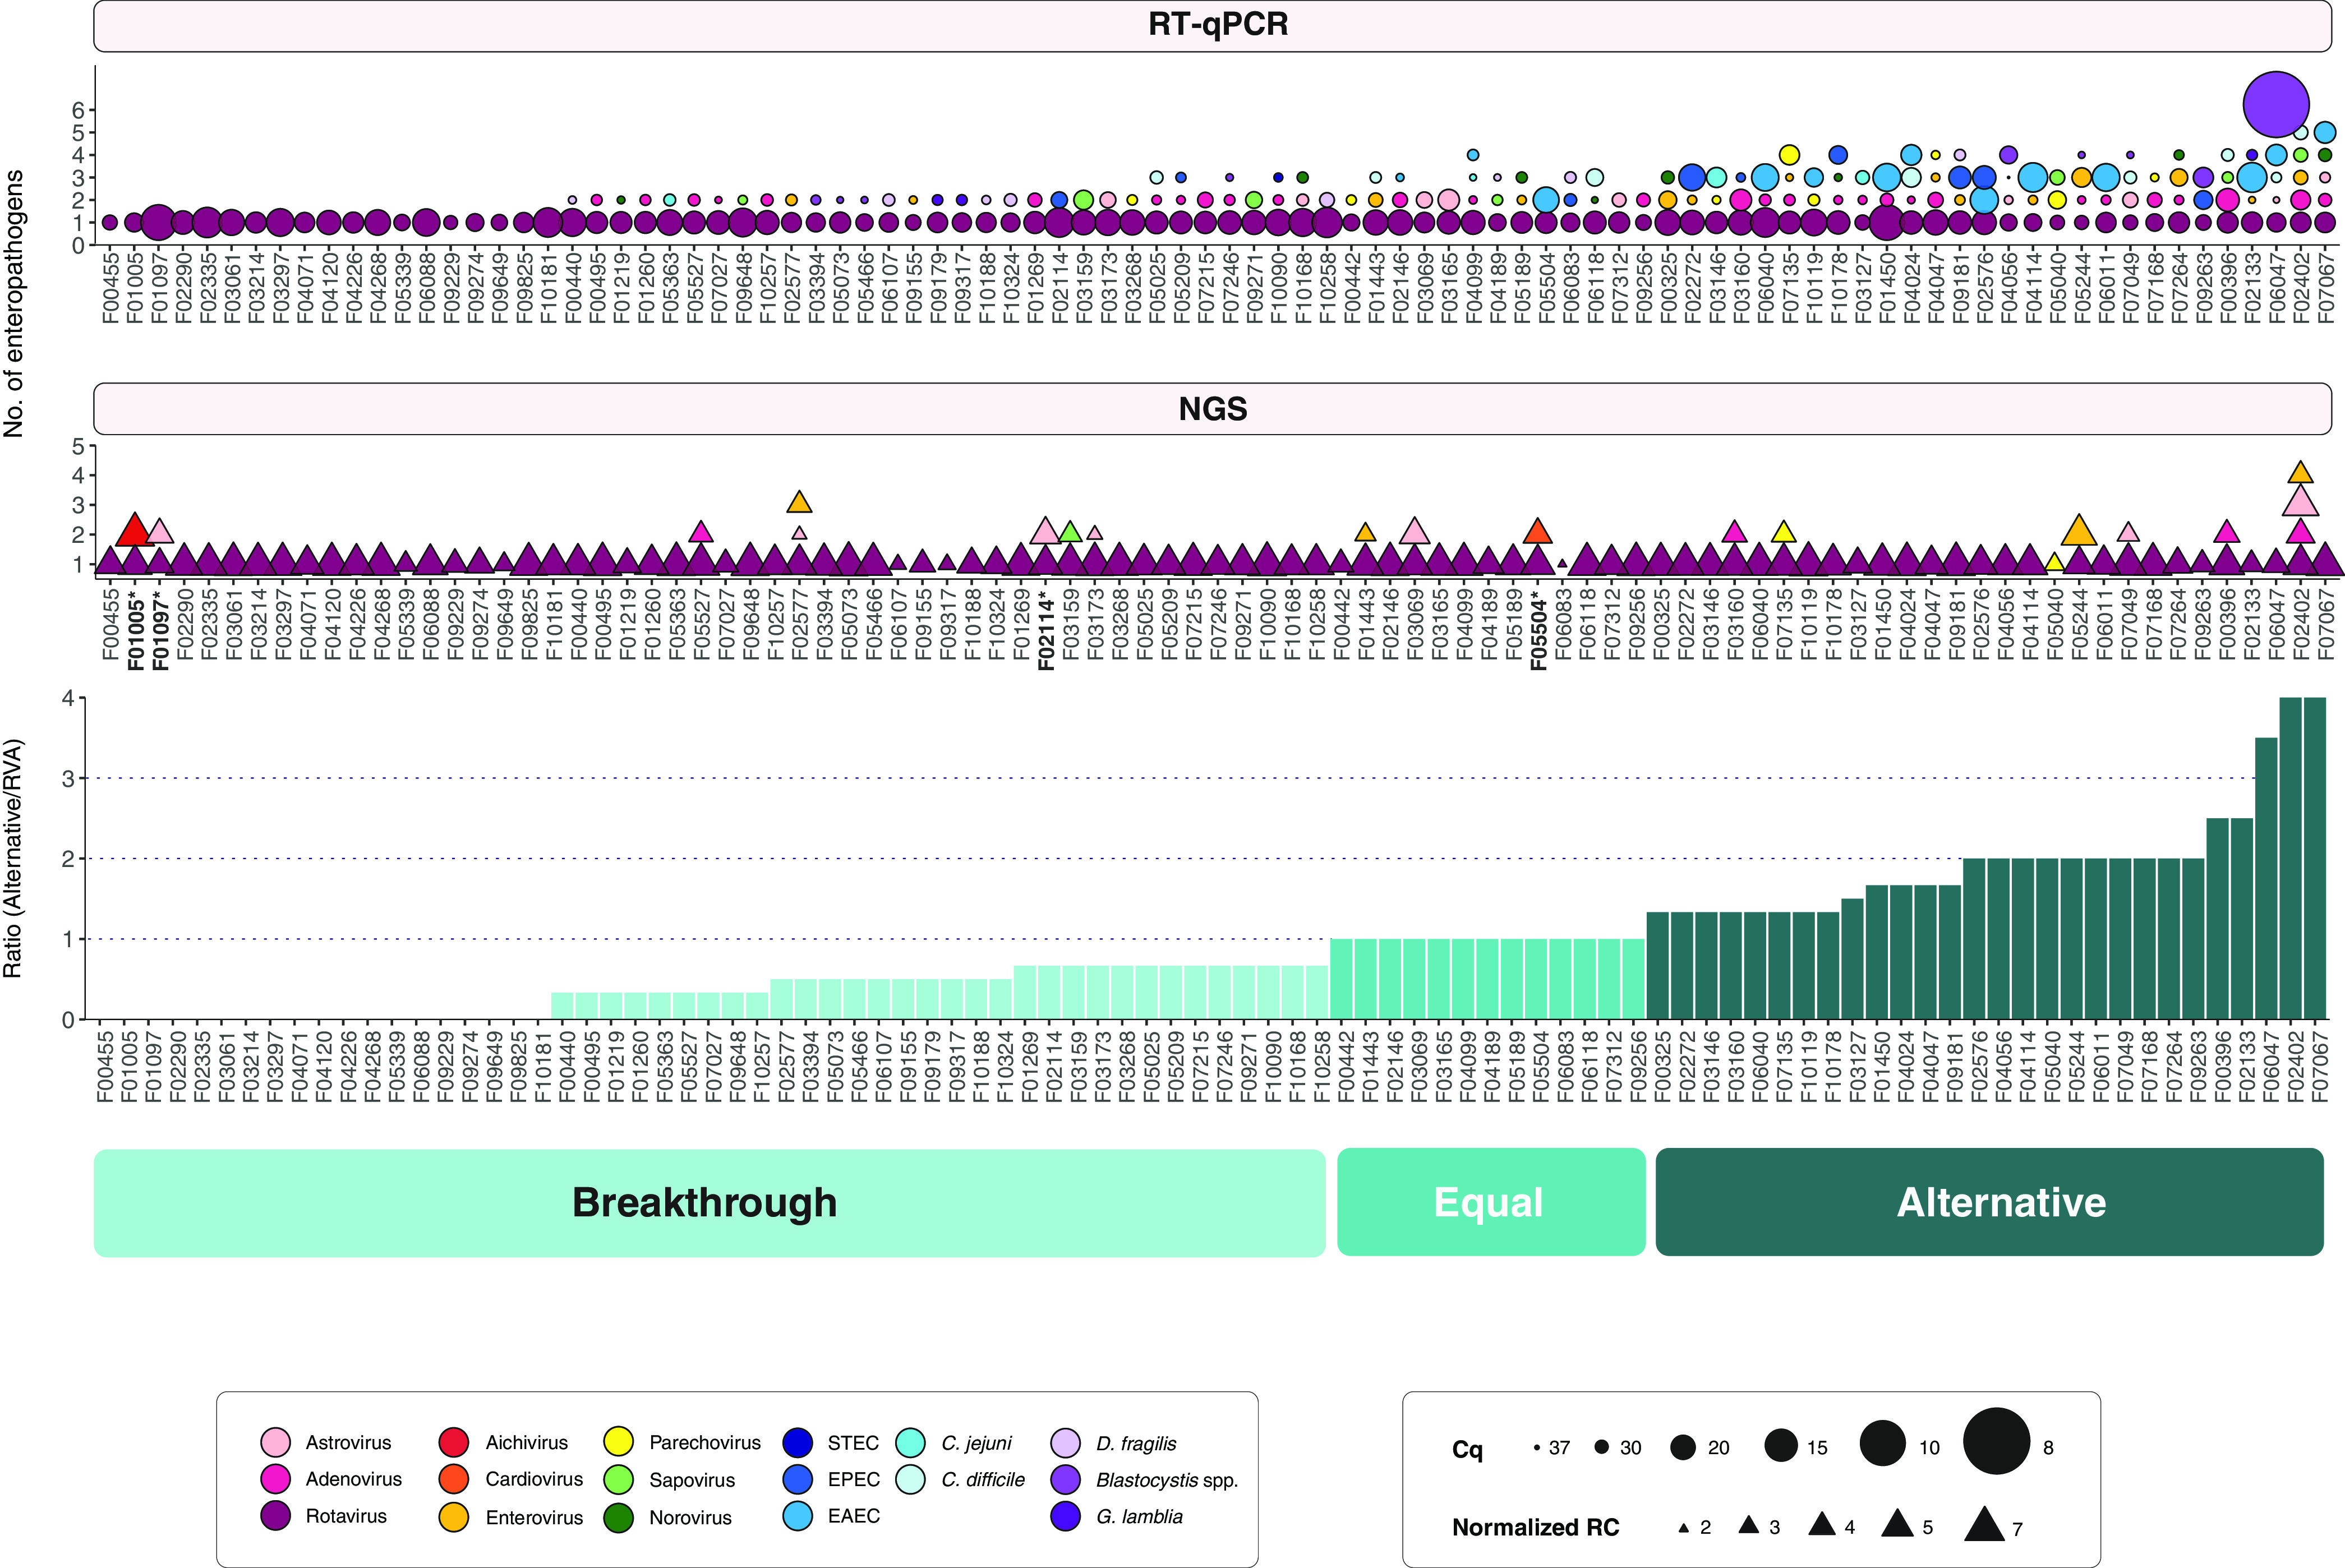
FIG 5.

Relative number of the enteropathogens detected in rotavirus breakthrough cases (top) and classification into gastroenteritis etiology groups (bottom). The top panel shows the Cq values based on the RT-qPCR results. The normalized NGS read counts (RC) per pathogen are shown in the middle panel. Different types of detected pathogens are shown in different colors: pink to green, viruses; blue, bacteria; purple, parasites. In the bottom, the grouping of the potential etiology of the gastroenteritis is shown, which is based on the given scores (see Materials and Methods). Samples marked with an asterisk contain a viral pathogen(s) which was not detected by RT-qPCR.
