FIG 3.

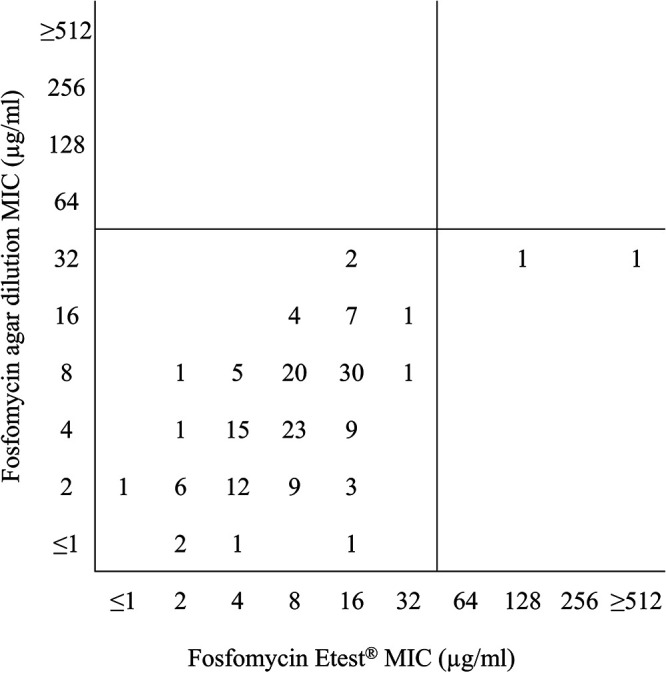
Scattergram comparing fosfomycin agar dilution MIC values to fosfomycin Etest MIC values for 156 Staphylococcus aureus isolates. EUCAST MIC breakpoints (≤32 μg/ml [susceptible], >32 μg/ml [resistant] [4]) were applied to the data set.

Scattergram comparing fosfomycin agar dilution MIC values to fosfomycin Etest MIC values for 156 Staphylococcus aureus isolates. EUCAST MIC breakpoints (≤32 μg/ml [susceptible], >32 μg/ml [resistant] [4]) were applied to the data set.