
FIG 3.
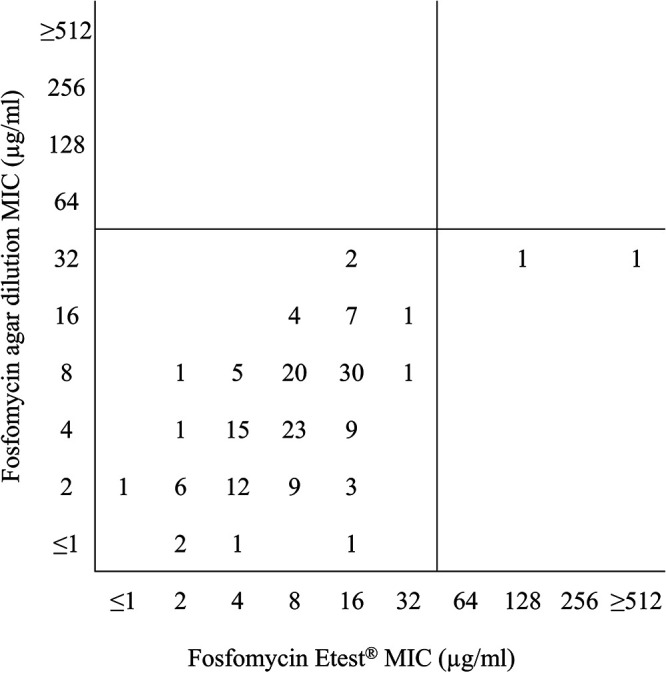
Scattergram comparing fosfomycin agar dilution MIC values to fosfomycin Etest MIC values for 156 Staphylococcus aureus isolates. EUCAST MIC breakpoints (≤32 μg/ml [susceptible], >32 μg/ml [resistant] [4]) were applied to the data set.
Official websites use .gov
A
.gov website belongs to an official
government organization in the United States.
Secure .gov websites use HTTPS
A lock (
) or https:// means you've safely
connected to the .gov website. Share sensitive
information only on official, secure websites.
Scattergram comparing fosfomycin agar dilution MIC values to fosfomycin Etest MIC values for 156 Staphylococcus aureus isolates. EUCAST MIC breakpoints (≤32 μg/ml [susceptible], >32 μg/ml [resistant] [4]) were applied to the data set.