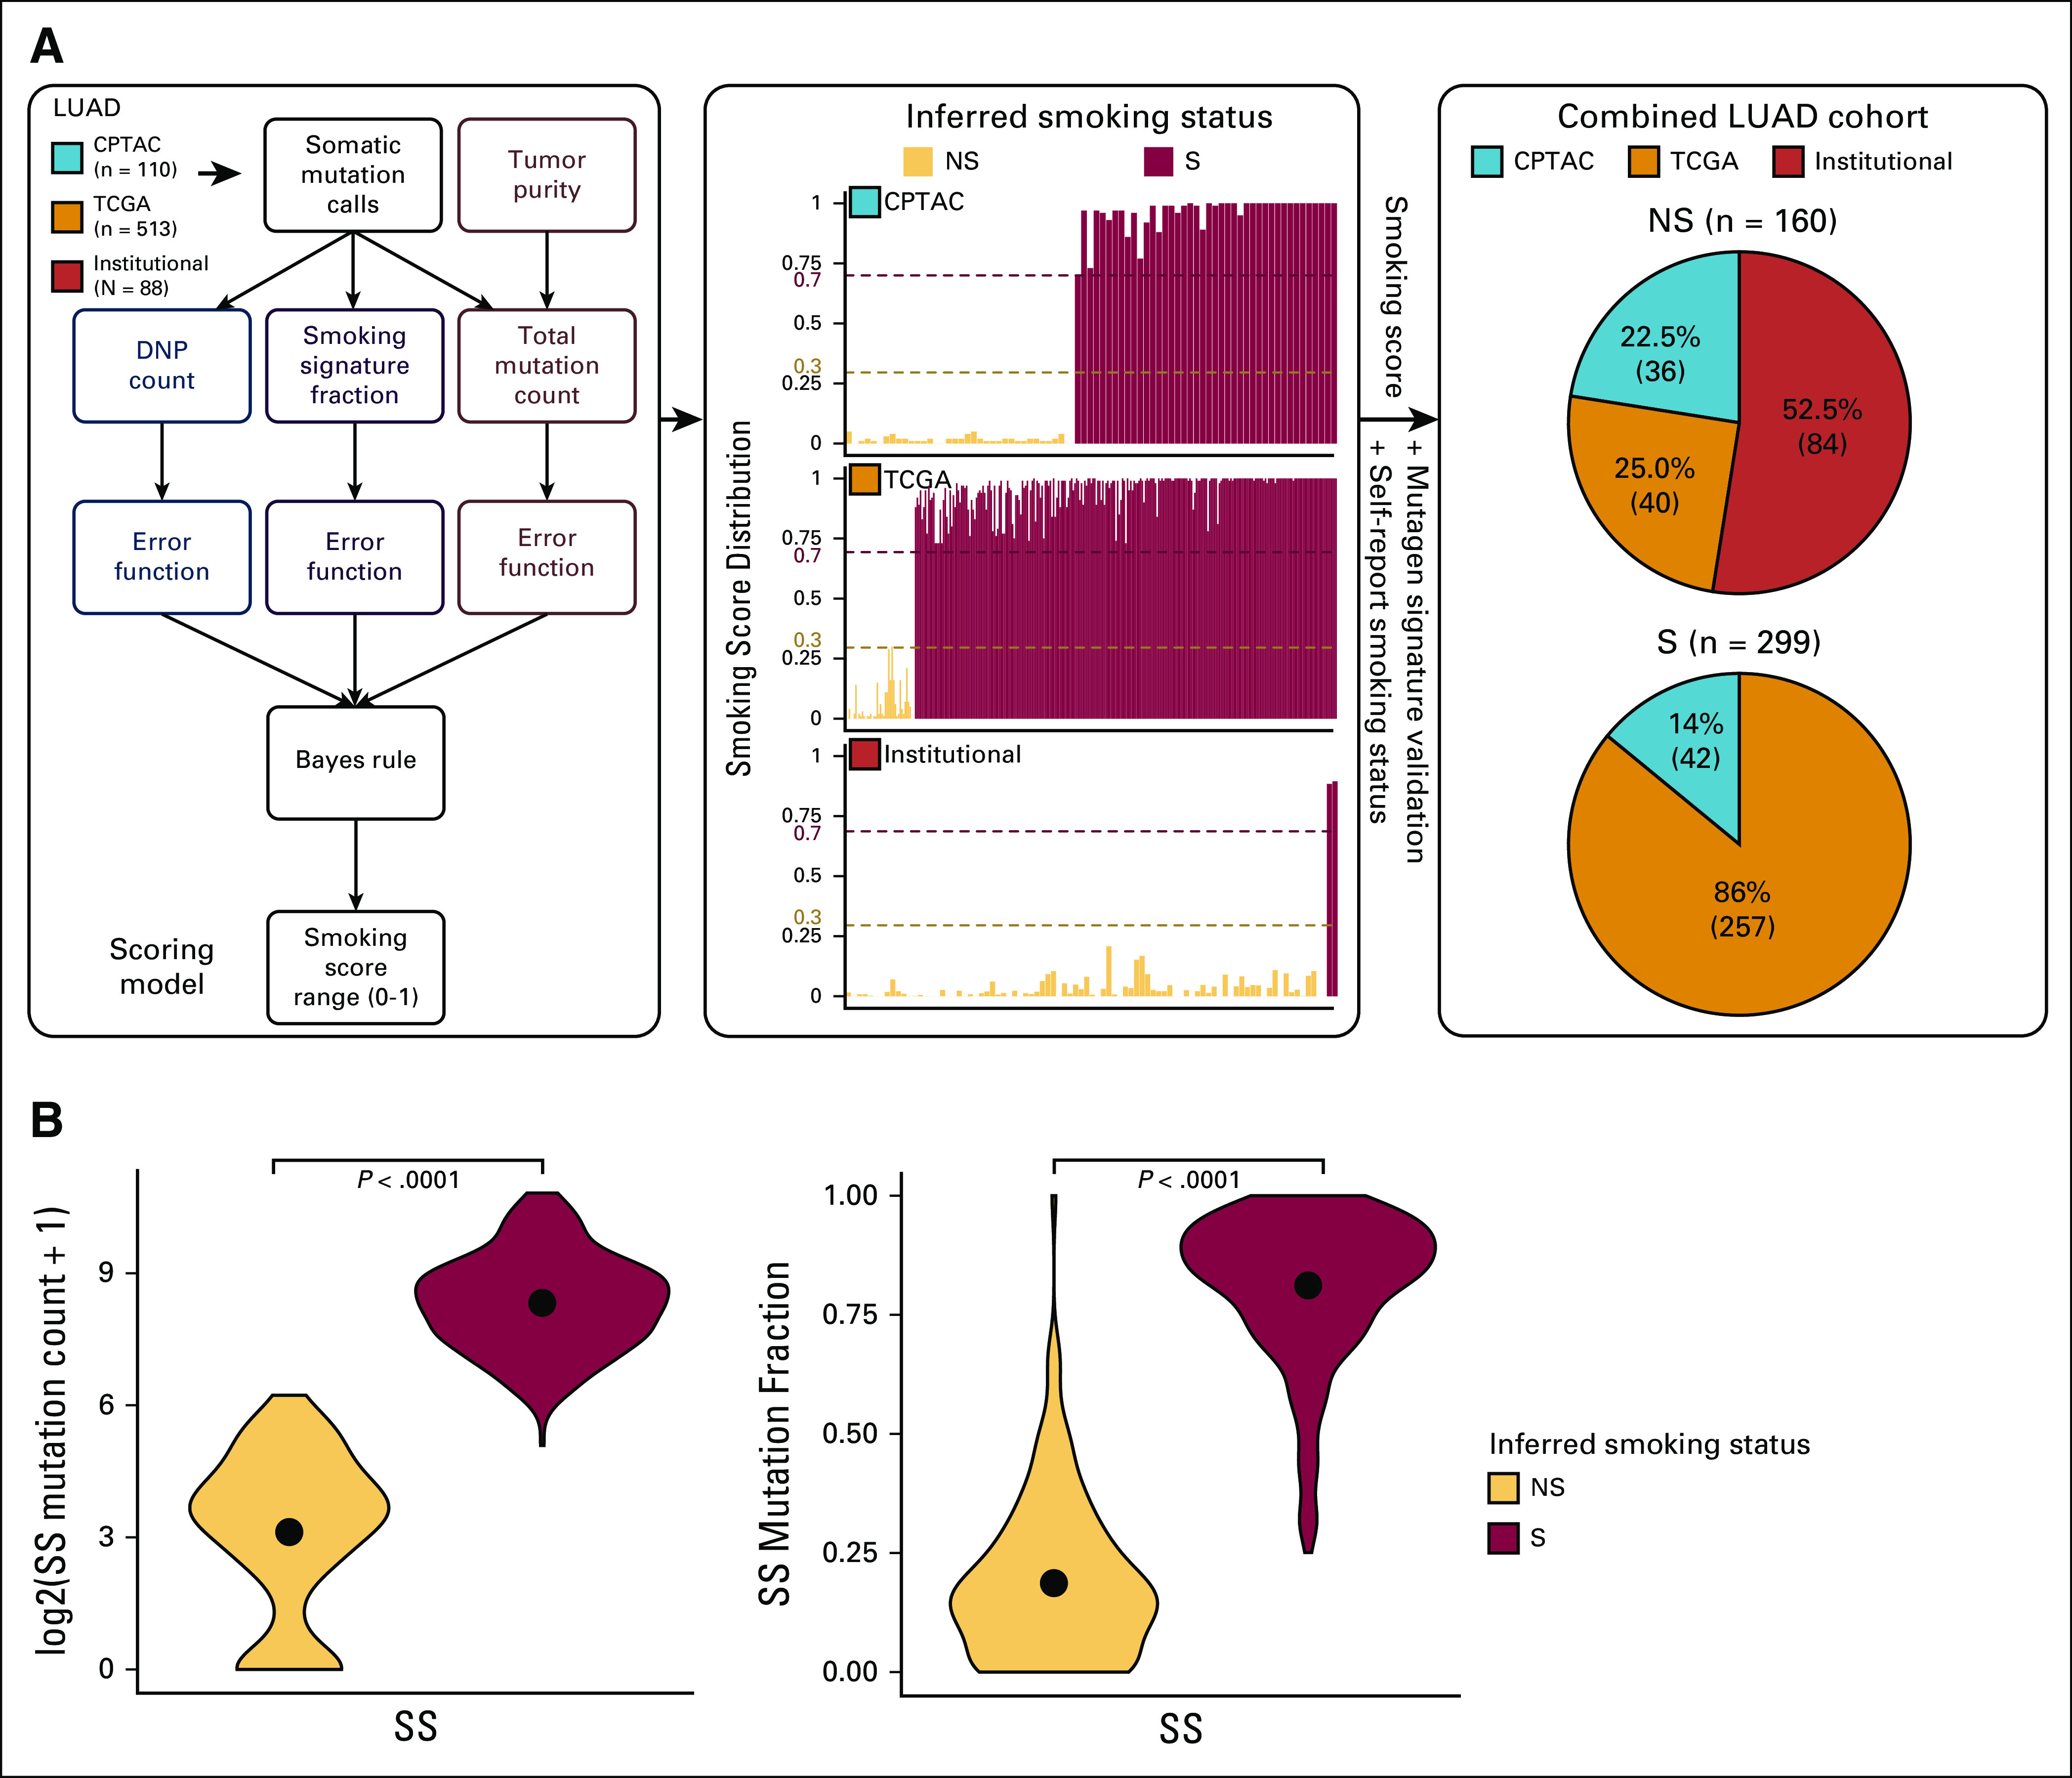
FIG 1.

The data-driven smoking classification in the LUAD cohorts (Institutional, CPTAC, and TCGA). (A) The flowchart presents the analysis steps included in deriving the scoring model (continuous smoking score range from 0 to 1). The bar charts show the smoking score distribution in each of the three cohorts. The smoking score (0.3 as the lower-bound cutoff and 0.7 as the upper-bound cutoff) along with the self-reported smoking status, and mutagen signature validation was used to infer smoking status. The pie charts represent the NS and S composition of each of the three cohorts on the basis of the inferred smoking status. In total, the NS group consisted of 160 samples and the S group contained 299 samples. (B) The violin plot shows the comparisons of log2-scaled total mutation counts and mutation fractions that contributed to the SS between NS and S samples (as inferred from steps described in Fig 1A). CPTAC, Clinical Proteomic Tumor Analysis Consortium; DNP, dinucleotide polymorphism; LUAD, lung adenocarcinoma; NS, never-smokers; S, smokers; SS, smoking signature; TCGA, The Cancer Genome Atlas.
