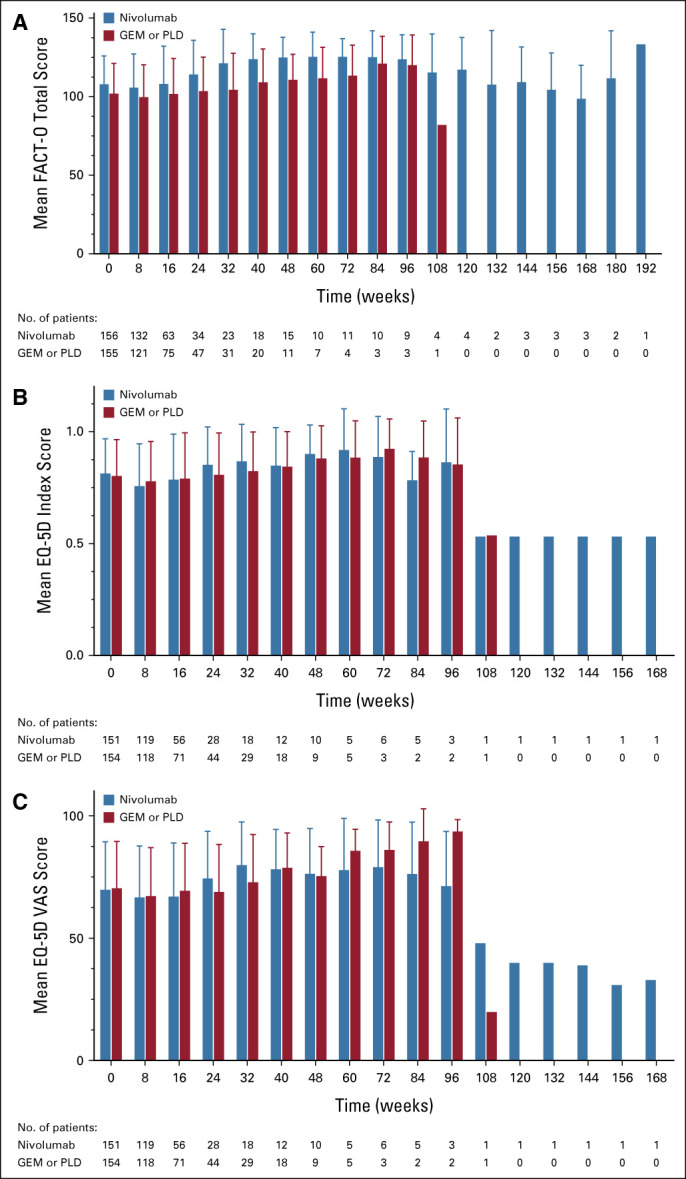
FIG A3.

Mean change in QOL over time: (A) FACT-O total score, (B) EQ-5D index score, (C) EQ-5D VAS score (ITT population). Error bars indicate standard deviation. EQ-5D, EuroQol-5 Dimensions; FACT-O, Functional Assessment of Cancer Therapy–Ovarian; GEM, gemcitabine; ITT, intention-to-treat; PLD, pegylated liposomal doxorubicin; QOL, quality of life; VAS, visual analog scale.
