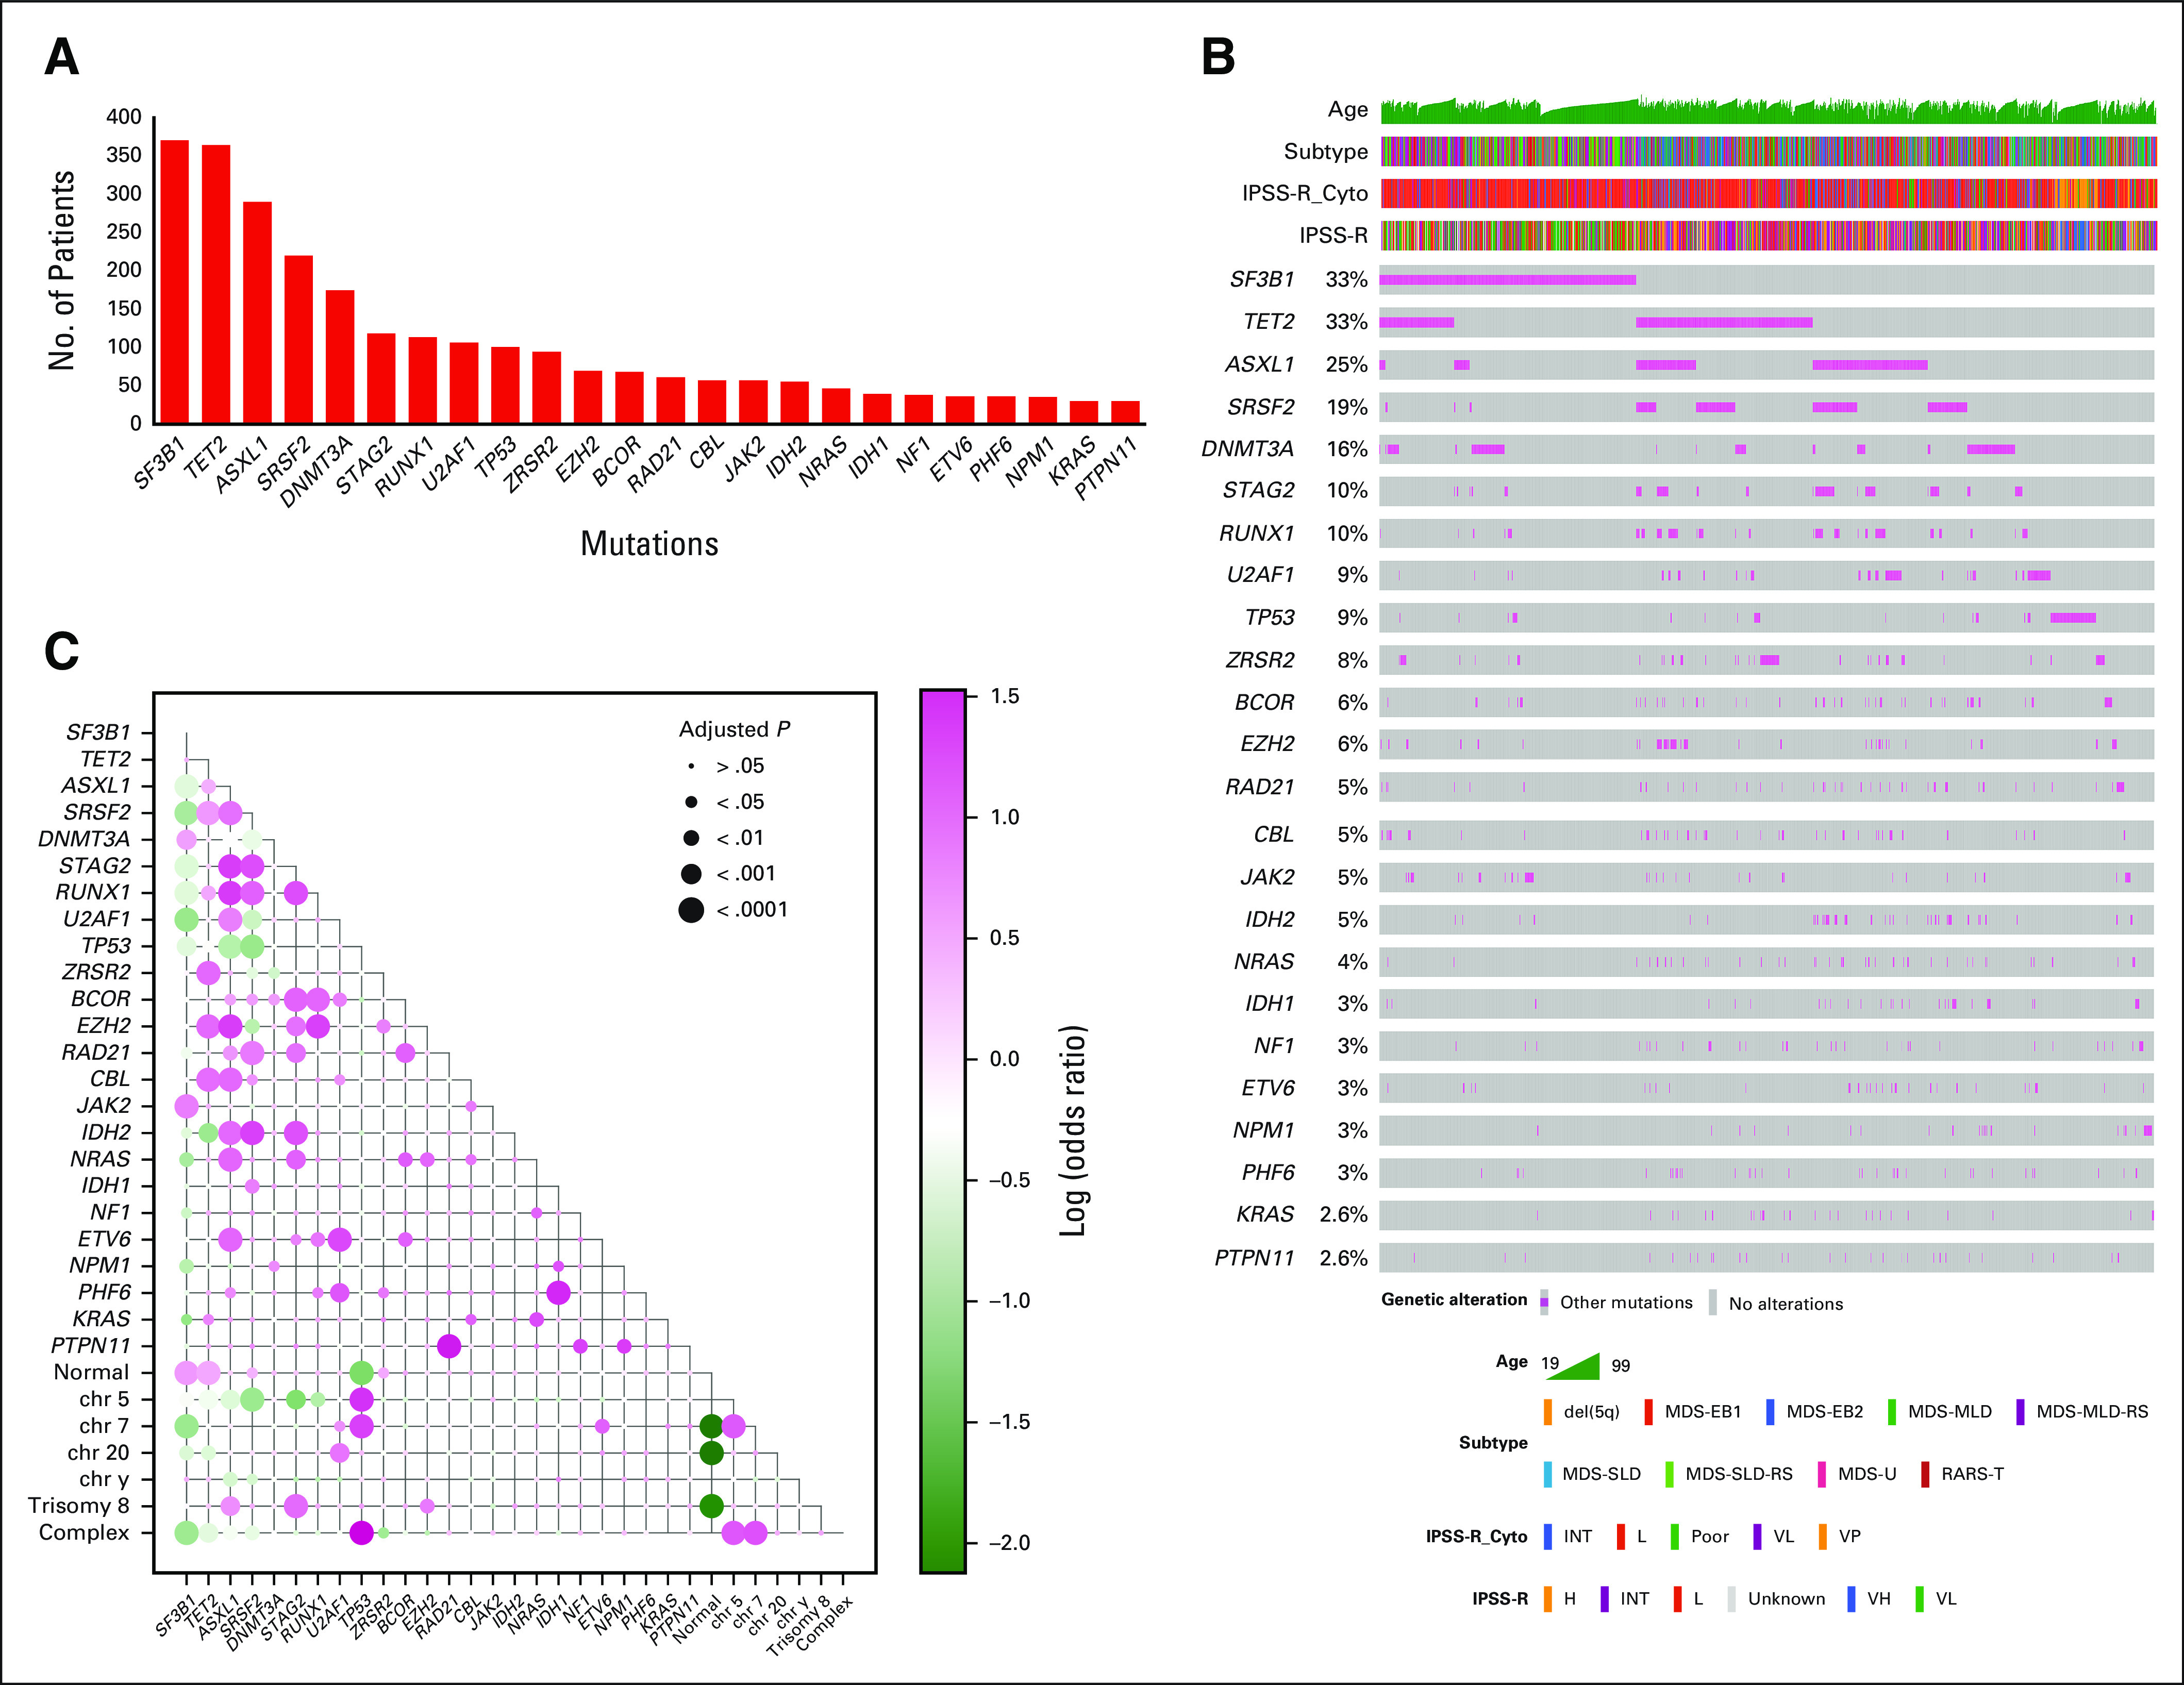
FIG 1.

Genomic landscape of the training cohort: (A) the graph represents frequencies of recurrent gene mutations in this cohort, (B) the mosaic plot represents distributions of recurrent gene mutations in 1,471 patients, and (C) exclusivity and co-occurrence between different gene mutations. The circles were sized and colored according to their log (odds) from Fisher's exact test and person correlation (pink color represents co-occurrence, and green color represents exclusivity). H, high; INT, intermediate; IPSS-R, revised International Prognostic Scoring System; L, low; MDS, myelodysplastic syndromes; MDS-EB, MDS-excess blasts; MDS-U, MDS unclassifiable; MLD, multilineage dysplasia; OS, overall survival; RARS, refractory anemia with ring sideroblasts; RARS-T, RARS with thrombocytosis; RS, ring sideroblast; SLD, single lineage dysplasia; VH, very high; VP, very poor; VL, very low.
