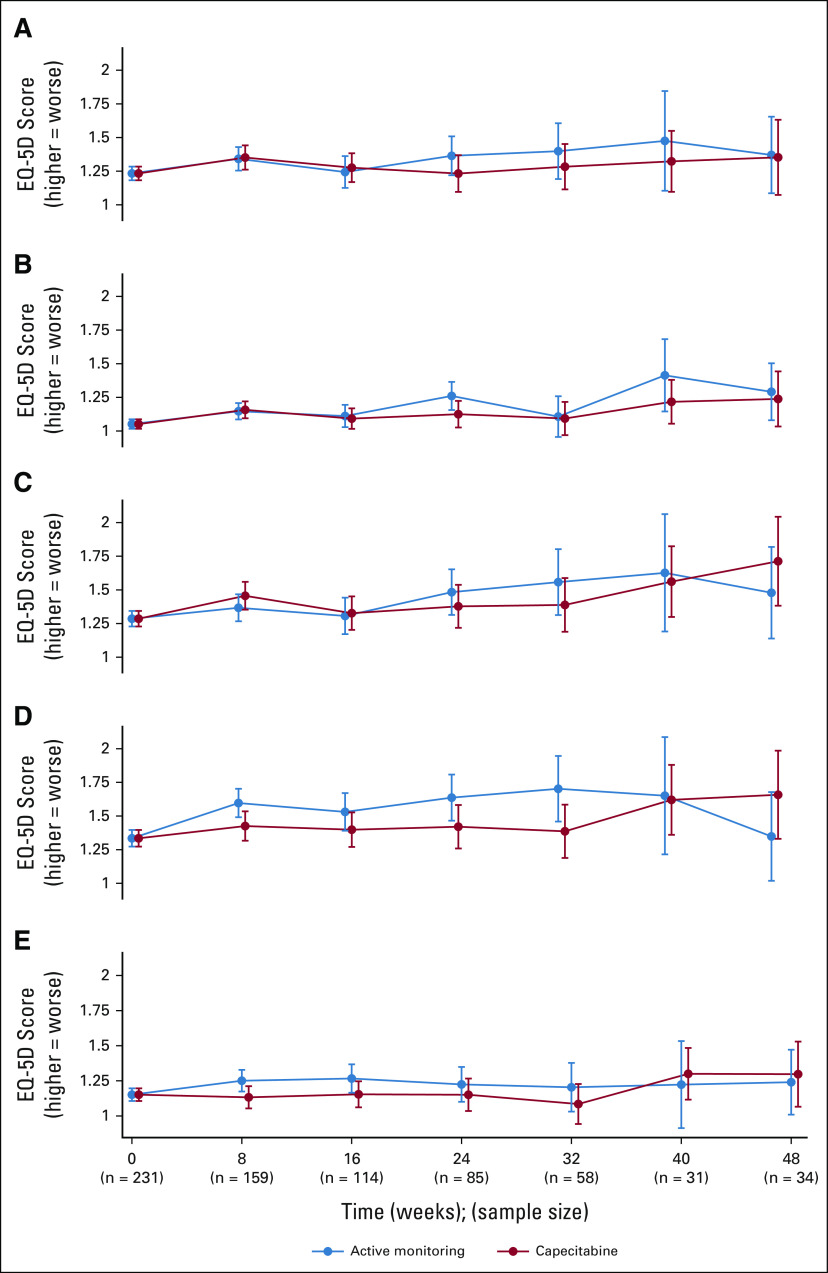
FIG 6.
Quality of life measured by EQ-5D by randomized group: (A) mobility: X2 for AUC difference = 0.86(1), P = .35; (B) self-care: X2 for AUC difference = 1.64(1), P = .20; (C) usual activities: X2 for AUC difference = 0.06(1), P = .81; (D) pain and discomfort: X2 for AUC difference = 2.49(1), P = .11; and (E) anxiety and depression: X2 for AUC difference = 1.03(1), P = .31; AUC, area under the curve.

