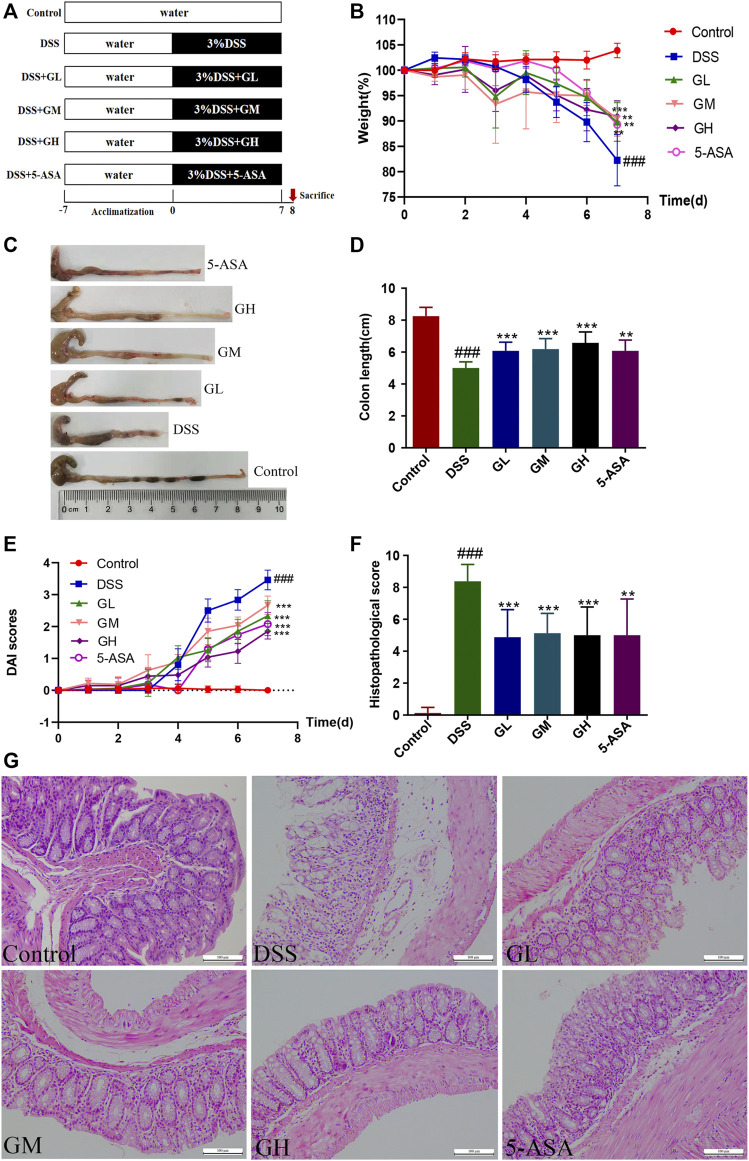
FIGURE 1.
MGQD intervention ameliorated DSS-induced experimental colitis in mice. (A) The schematic diagram of UC model and drug treatment. (B) Percentage change of body weight. (C) Representative photograph of colons. (D) Statistics of colon length. (E) Disease activity index (DAI) score. (F) The histological scores of mouse colon morphology. (G) Representative microscopic pictures of H and E staining (amplification,×200). Results were shown as mean ± SD (n = 8–10). ###p < 0.001, vs control group; **p < 0.01, ***p < 0.001, vs DSS group.

