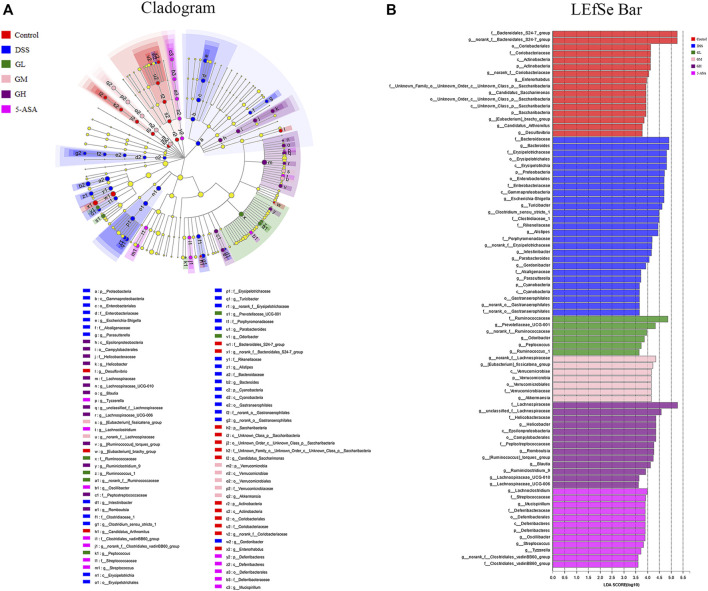
FIGURE 5.
Screening of differentially abundant microbial taxa using linear discriminant analysis (LDA) coupled with effect size (LEfSe) analysis. (A) Taxonomic cladogram obtained from LEfSe analysis of 16S sequences. Yellow dots indicate no statistical significance. (B) Distribution histogram based on LDA, with a log LDA score above 3.6. The LDA histogram showed significant differences in species, which were all greater than the preset value. The color of the histogram represents each group, and the length of the histogram can express the degree of influence of species with significant differences between different groups.

