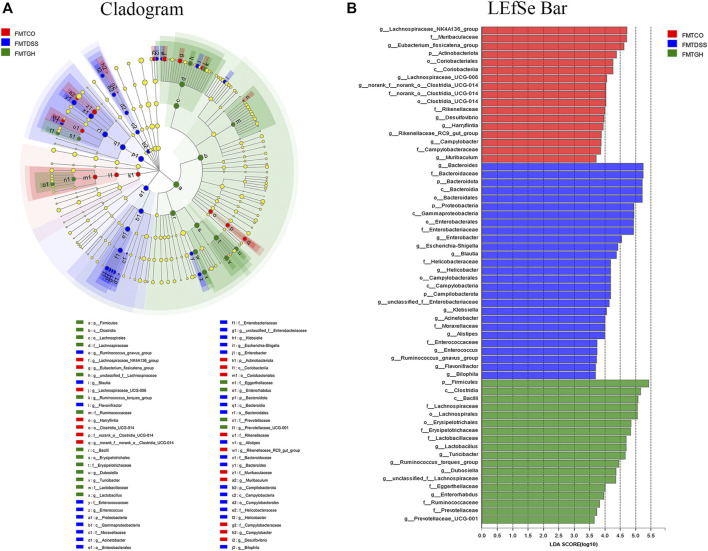
FIGURE 8.
Screening of differentially abundant microbial taxa using linear discriminant analysis (LDA) coupled with effect size (LEfSe) analysis. (A) Cladogram obtained from LEfSe analysis with presenting various levels (from phylum to genus) from inner to outer rings. (B) Biomarker taxons generated from LEfSe analysis. The criteria for feature selection is log LDA score >3.6.

