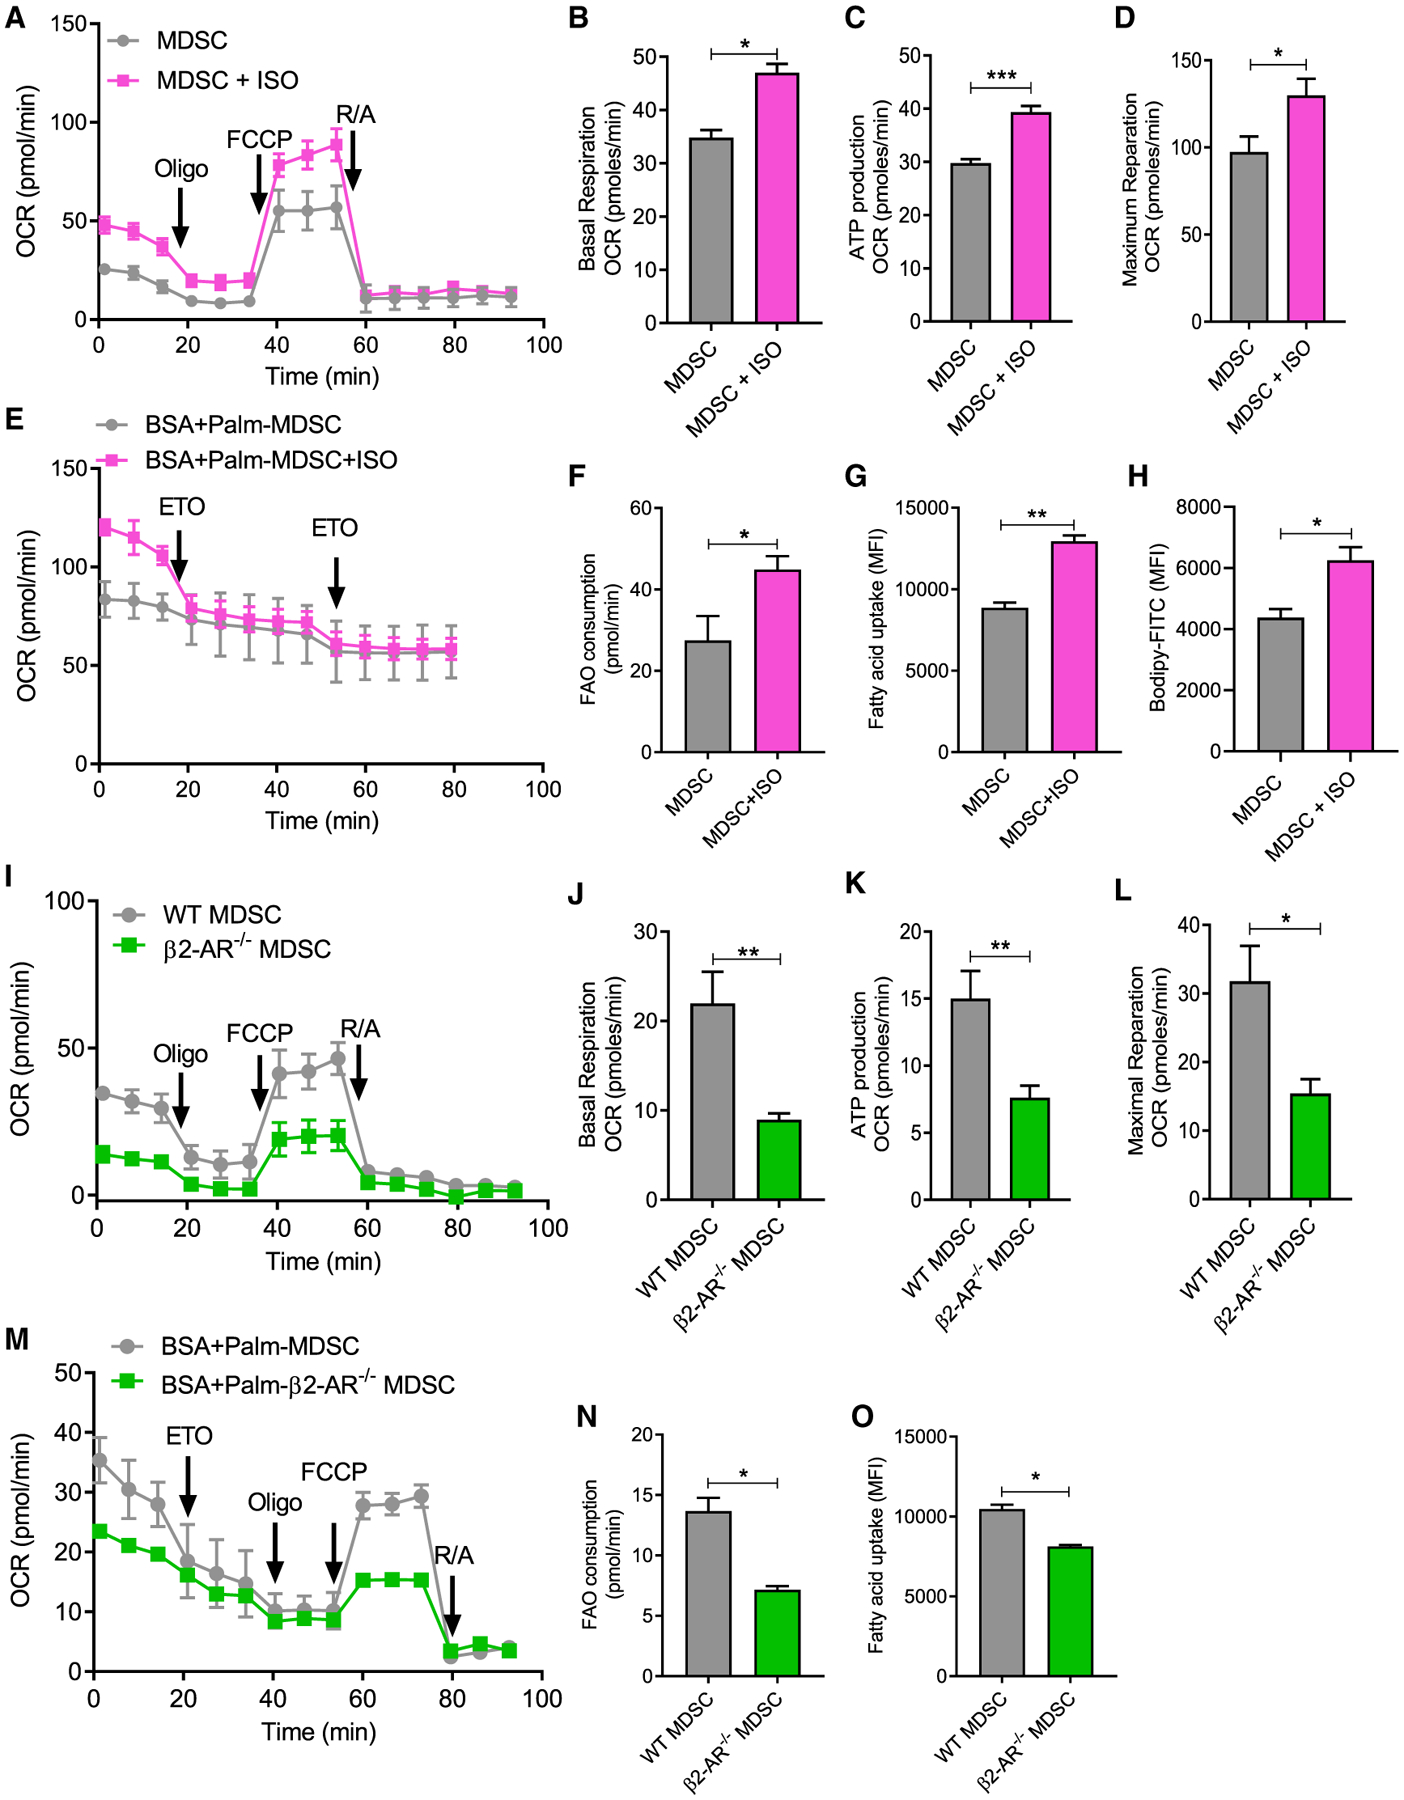
Figure 2. β-AR signaling in MDSCs decreases glycolysis and enhances oxidative phosphorylation.

(A–H) MDSCs were derived from bone marrow in the presence of GM-CSF and IL-6, with or without isoproterenol (ISO).
(A) Mitochondrial respiration was measured using a Seahorse Extracellular Flux Analyzer (arrows indicate when reagents were added: (1) oligomycin; (2) FCCP; and (3) antimycin A and rotenone).
(B) Basal respiration levels.
(C) ATP production.
(D) Maximum respiration.
(E) FAO was measured using a Seahorse Extracellular Flux Analyzer in media in which palmitate was the only fatty acid source (arrows indicate when etomoxir [ETO] was added).
(F) FAO consumption.
(G and H) MDSCs were derived from bone marrow in the presence of GM-CSF and IL-6, with or without ISO and (G) fatty acid uptake (Bodipy FL C16) and (H) lipid accumulation (Bodipy FL 493/503) was measured.
(I–O) WT and β2-AR−/− mice were orthotopically implanted with 4T1 tumor cells. At day 25, WT or β2-AR−/− PMN- MDSCs were sorted by flow cytometry and the rates of (I–L) oxidative phosphorylation, (M and N) FAO, and (O) fatty acid uptake were measured. Mitochondrial respiration was measured using a Seahorse Extracellular Flux Analyzer (arrows indicate when reagents were added: [1] oligomycin; [2] carbonyl cyanide p-trifluoromethoxy-phenylhydrazone [FCCP]; and [3] antimycin A and rotenone).
(J) Basal respiration levels.
(K) ATP production.
(L) Maximal respiration.
(M and N) FAO was measured using a Seahorse Extracellular Flux Analyzer in media in which palmitate was the only fatty acid source (arrows indicate when ETO was added). (N) FAO consumption.
(O) WT and β2-AR−/− PMN-MDSCs were sorted from 4T1 tumor-bearing mice, and fatty acid uptake in WT or β2-AR−/− were analyzed by flow cytometry.
These data are presented as means ± SDs from 3 biological replicates in all of the graphs, and the Student’s t test was used to analyze statistical significance between 2 groups. In all of the panels, *p < 0.05, **p < 0.01, and ***p < 0.001. p < 0.05 was considered significant.
