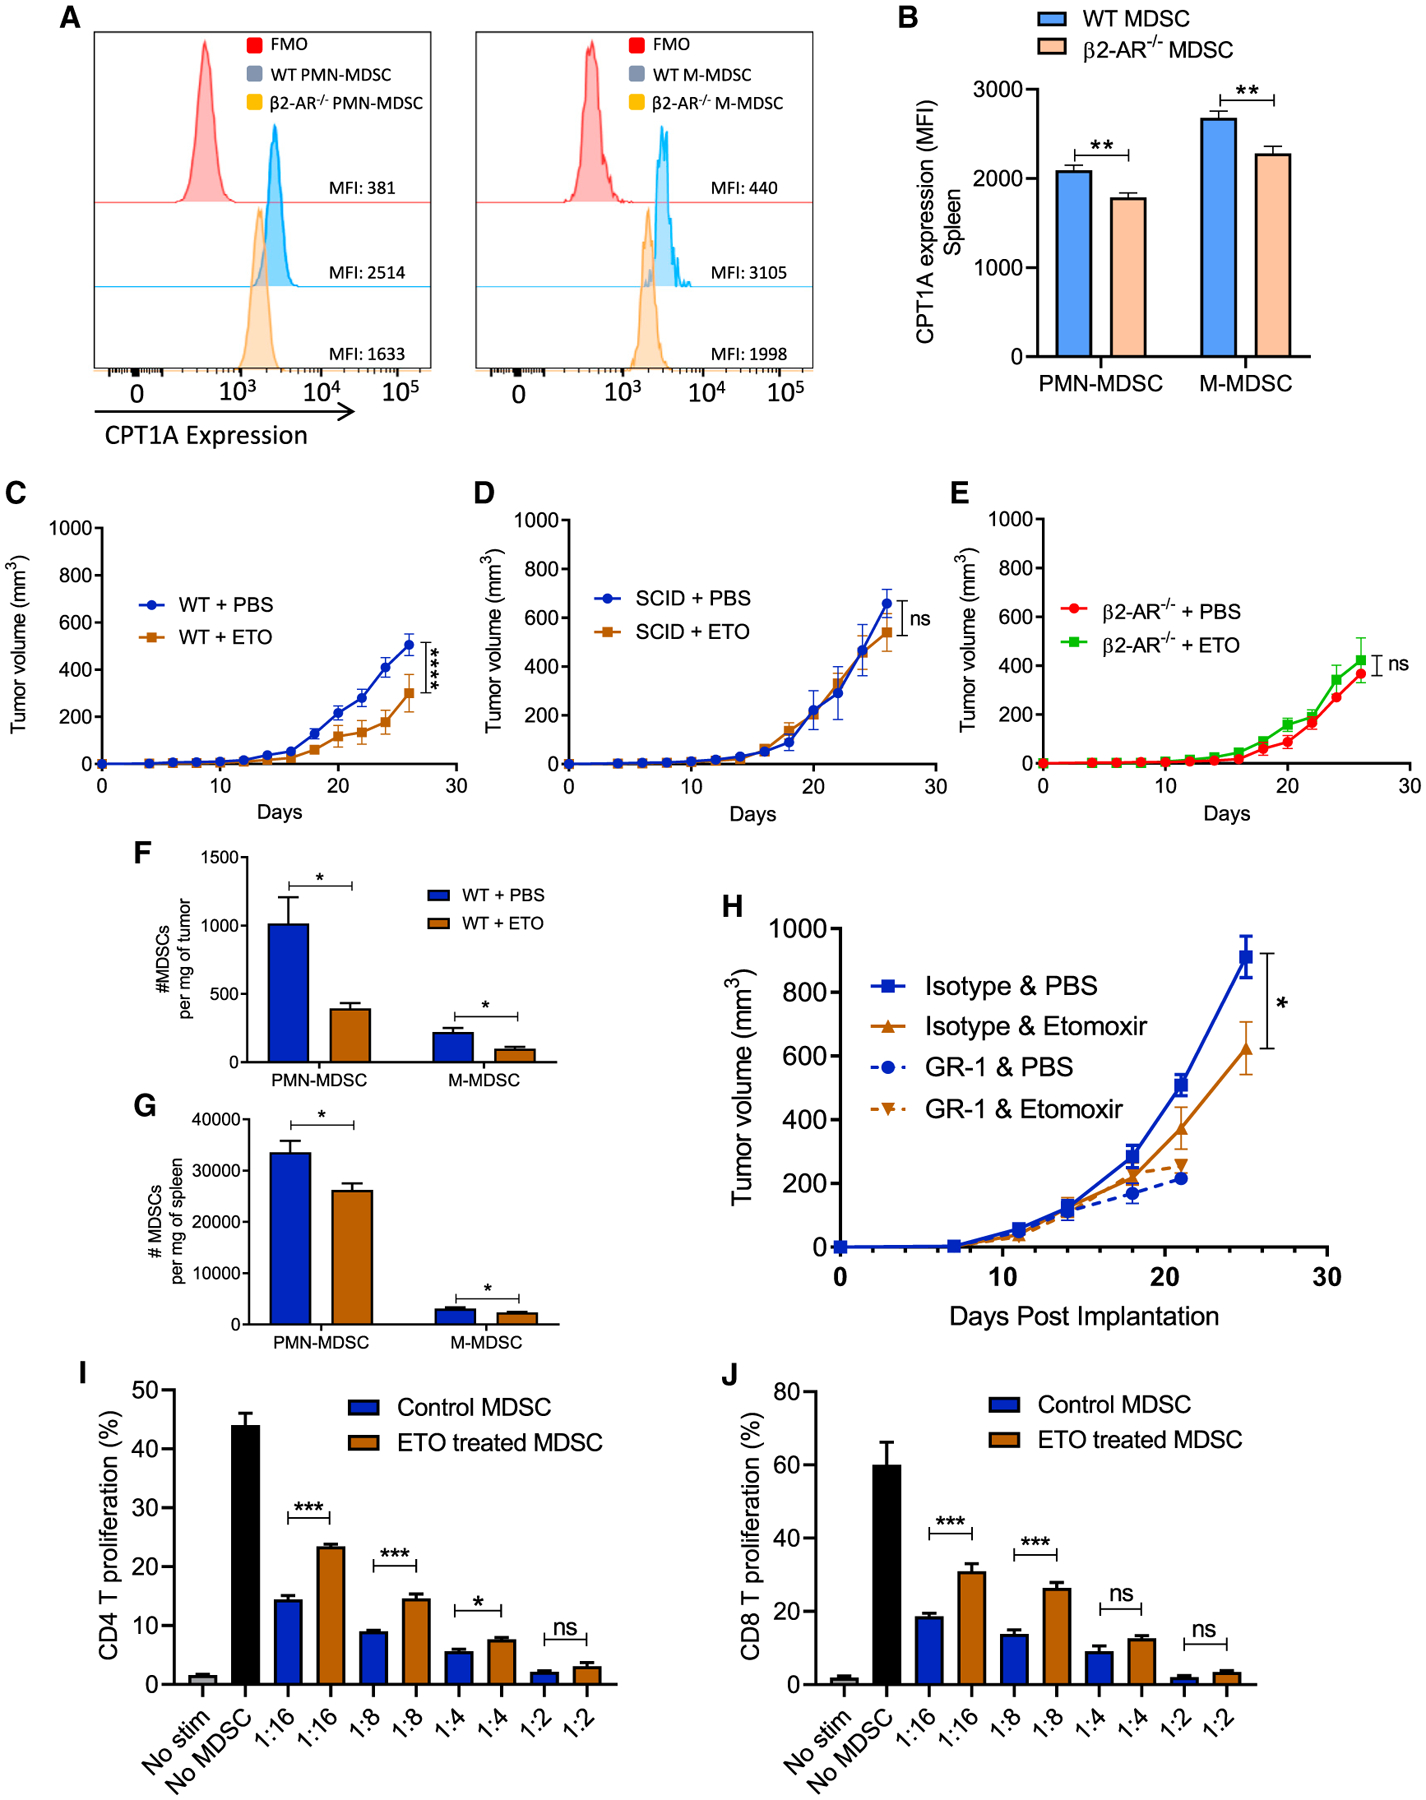
Figure 3. Fatty acid oxidation (FAO) inhibition decreases MDSC populations in tumor-bearing mice.

(A) Histogram presentation of CPT-1 expression in WT versus β2-AR−/− MDSC isolated from WT and β2-AR−/− 4T1 tumor-bearing mice.
(B) CPT1A expression in splenic MDSCs isolated from WT or β2-AR−/− 4T1 tumor-bearing mice.
(C) Tumor growth kinetics in WT or β2-AR−/− mice orthotopically injected with 4T1 tumor cells receiving PBS or ETO (intraperitoneal [i.p.] daily injection) (n = 10).
(D) Tumor growth kinetics in SCID mice orthotopically injected with 4T1 tumor cells receiving PBS or ETO (i.p. daily injection) (n = 5).
(E) Tumor growth kinetics in β2-AR−/− mice orthotopically injected with 4T1 tumor cells receiving PBS or ETO (i.p. daily injection) (n = 10).
(F and G) Absolute number of PMN-MDSCs and M-MDSCs in the tumors and spleens of tumor-bearing mice (4T1) on day 25 after tumor injection treated with PBS or ETO.
(H) 4T1-bearing WT mice were injected with isotype or anti-Gr-1 antibodies (i.p. 200 μg per mouse every 4 days), in combination with PBS or ETO, and tumor growth was monitored. The data presented are from groups of 5–10 mice from 2 replicate studies.
(I and J) WT mice orthotopically injected with 4T1 cells. Mice were treated with PBS or etomoxir for 25 days. On day 25, PMN-MDSCs were sorted from the spleen using an MDSC isolation kit. Isolated MDSCs were cultured with T cells in the presence of CD3/CD18 beads and IL-2 in various ratios, and CD4 and CD8 proliferation were measured (n = 3). Two-way ANOVA was used to analyze statistical significance between tumor growth in different groups.
Data are presented as means ± SDs. The Student’s t test was used to analyze statistical significance between 2 groups. In all of the panels, *p < 0.05, **p < 0.01, ***p < 0.001, and ****p < 0.0001. p < 0.05 was considered significant.
