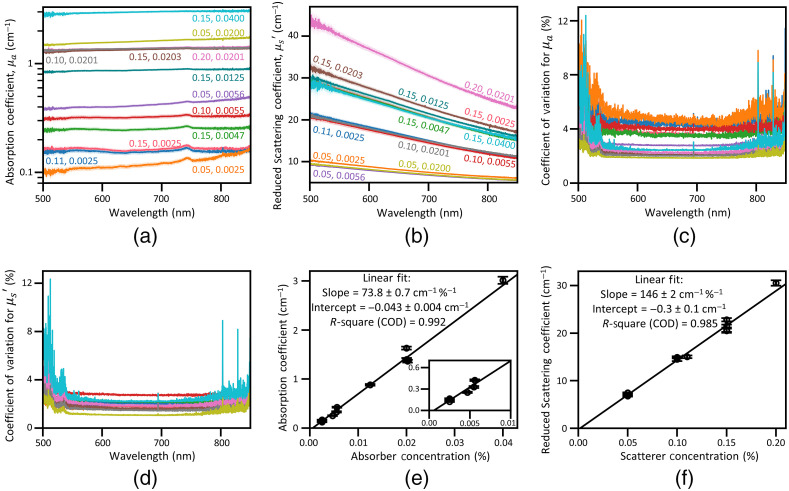
Fig. 3.
Optical properties of the phantoms. (a) Absorption and (b) scattering coefficients of the phantoms with both TDP and CBP at various concentration combinations across the wavelength range of 500 to 850 nm. The numbers labeling each curve are the concentrations (% w/w) of TDP and CBP, respectively. (c), (d) The coefficient of variation of the absorption and scattering coefficients of each sample. The curve for each sample is plotted using the same color scheme as in (a) and (b). (e) Absorption and (f) reduced scattering coefficients at 700 nm versus the concentration of CBP and TDP, respectively, demonstrating that both coefficients depend linearly on the concentration of the corresponding additive. Note that high CODs confirm excellent linear fit for both cases. Other details of the fitting results are listed as well. The inset of (e) shows the absorption coefficient at low absorber concentration. In (a), (b), (e), and (f), the plotted uncertainties [shaded areas in (a) and (b) and the bars in (e) and (f)] for the coverage factor are calculated as described in Sec. 2.

