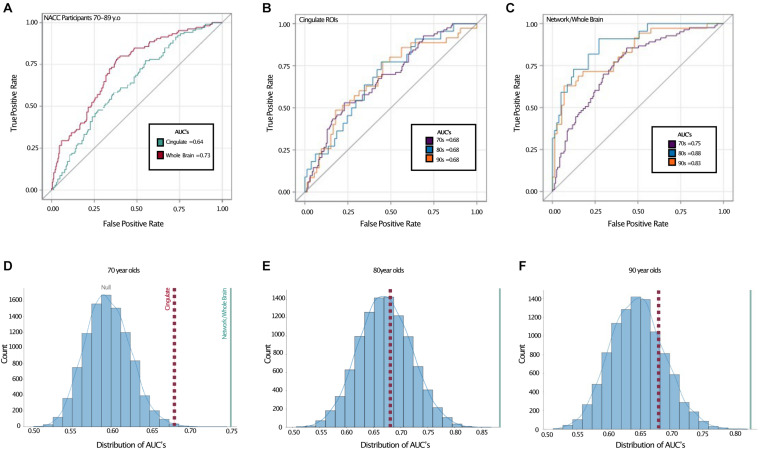
FIGURE 3.
Receiver operating characteristic curves show better TCP predictive performance in whole brain model. Top: ROC curves with area under the curves (AUC) displayed for (A) entire NACC sample (ages 70–89), (B) a priori cingulate regions in all age groups, and (C) network/whole-brain forward-selected ROIs across all age groups. Bottom: Permutation analyses where the labeling of TCP vs. non-TCP was shuffled 10,000 times in (D) NACC 70 year olds, (E) NACC 80 year olds, and (F) The 90 + Study 90 year olds. Red dotted lines represent AUC’s for a priori cingulate ROIS reflected in (B) and blue solid lines represent AUC for network/whole-brain forward-selected ROIs reflected in (C). AUC: Area under the curve, 70s: NACC 70 year olds, 80s: NACC 80 year olds, 90s: The 90 + Study 90 year olds.

