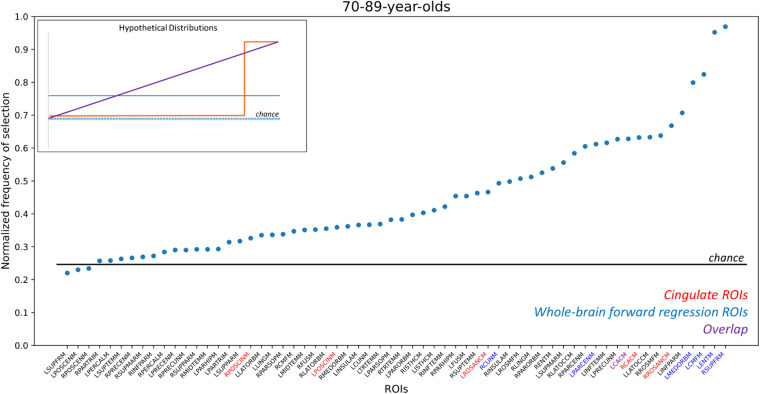
FIGURE 4.
Frequency of ROI selection in bootstrapping analysis. Random samplings of subjects matching our existing TCP rates were repeatedly drawn and analyzed using the same logistic forward regression to determine how often each ROI was selected by the model. ROIs here are sorted by their frequency of being selected, which was normalized by the number of iterations (n = 1,000) to scale from 0 to 1, and ROI names are color-coded by whether they are part of the cingulate (red), were in the original whole-brain model (blue), or both (purple). The horizontal line reflects the chance frequency of selection. ROI names are based on NACC labels. RPOSCINM, Right Posterior Cingulate; LPOSCINM, Left Posterior Cingulate; LROSANCM, Left Rostral Anterior Cingulate; RCUNM, Right Cuneus; LPARCENM, Left Paracentral; LCACM, Left Caudal Anterior Cingulate; RCACM, Right Caudal Anterior Cingulate; RROSANCM, Right Rostral Anterior Cingulate; LMEDORBM, Left Medial Orbital; LCMFM, Left Caudal Middle Frontal; LENTM, Left Entorhinal; RSUPFRM; Right Superior Frontal. For full list, please refer to NACC’s Imaging Data Researcher’s data dictionary: https://files.alz.washington.edu/documentation/rdd-imaging.pdf. Inset figure: Hypothetical distributions that would arise from different underlying models: (orange) distribution that would result if only a small subset of regions were highly predictive; (purple) distribution that would result if an even gradient of predictive ability existed across regions; (blue, dashed) distribution that would result if no regions’ cortical thickness could model TCP status; (blue, solid) distribution that would result if all regions had some predictive power but there was no differentiation across regions.

