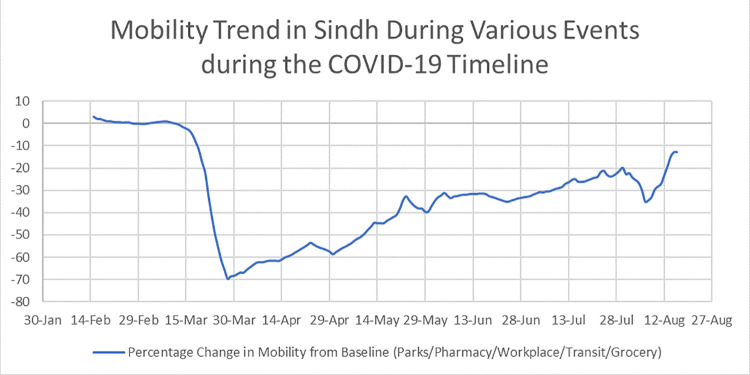
Fig 1. The mobility patterns recorded in Sindh during the period of January to August 2020.
Dataset have been taken from publicly online database (www.google.com/covid19/mobility/). This figure depicts the percentage change in mobility during the period of 30th Jan to 16th August 2020. Mobility patterns have been recorded for people leaving their residence for visiting parks, pharmacies, workplace, bus or train stations and for grocery shopping.

