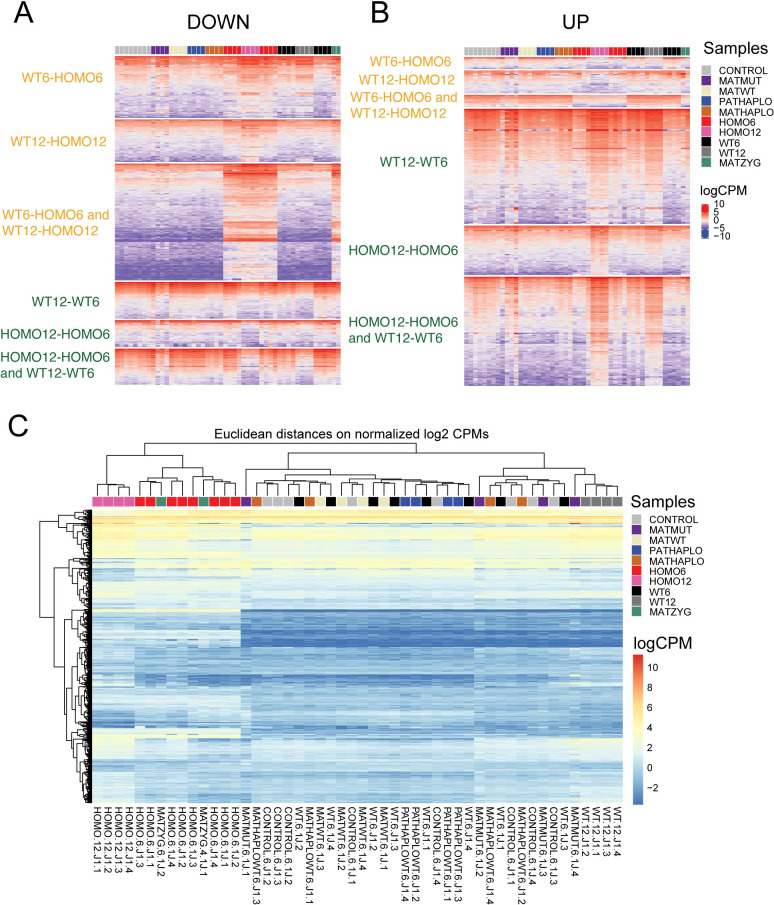
Fig 5. Transcriptomes of embryos with different Ehmt2 genetic deficiencies.
Heatmaps display gene expression values (logCPM) for the downregulated (A) and upregulated (B) genes from the compartments of the Venn diagrams in Fig 3D and 3E, as marked, representing the full dataset (Fig 1A and S2 Table). Four replicates are shown in the samples coded by color (to the right). (C) Heatmap displays the results of an unsupervised cluster analysis that calculates Eucledian distance between samples based on the DE genes identified in the four-way comparison displayed in the Venn diagrams in Fig 3D and 3E.

