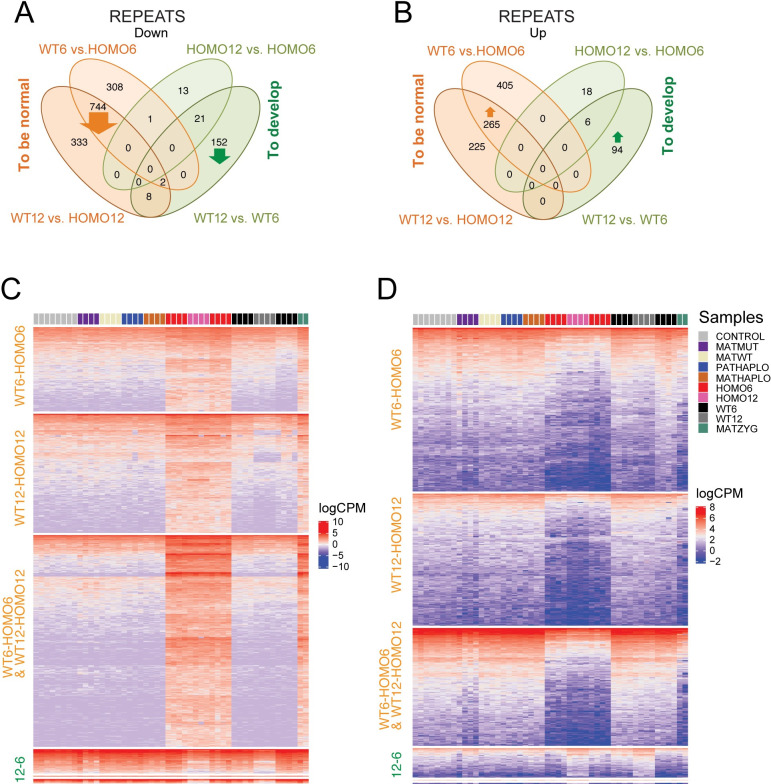
Fig 8. Four-way comparison of uniquely mapped transposable elements.
(A-B) Venn diagram showing downregulated (A) and upregulated (B) repeats which were identified using uniquely mapped reads and were stratified according to the four-way comparison. (C-D) Heatmaps of downregulated (C) and upregulated (D) repeats as shown in the above Venn diagrams, with comparisons labeled to the left, samples indicated at the top and color codes shown to the right. The category labeled 12–6 contains WT12-WT6 and HOMO12-HOMO6 and their intersection. Note that most DE repeats are related to genotype. Note the variability of derepression in HOMO6 and MATMUT samples. Note that MATZYG embryos are most similar to HOMO6 embryos.

