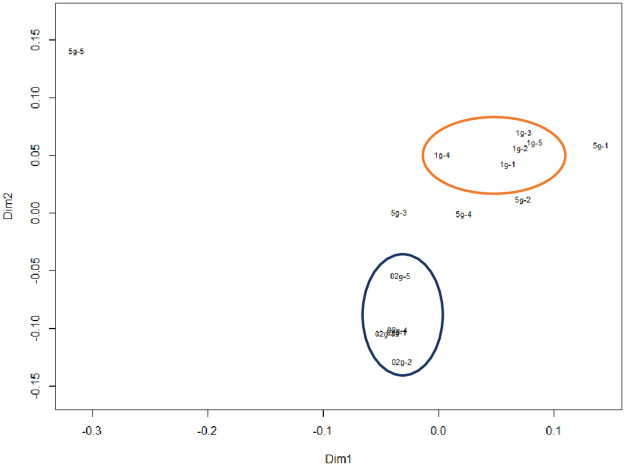
Fig 7. Non-metric multidimensional scaling (NMDS) plots at the order rank.
The orange (upper) circle shows the aggregation sites with the 1 g soil sample sizes, and the blue (lower) circle shows those of the 0.2 g soil sample sizes. Points outside the circles are those of the 5 g soil sample sizes. 2D stress was 0.19.

