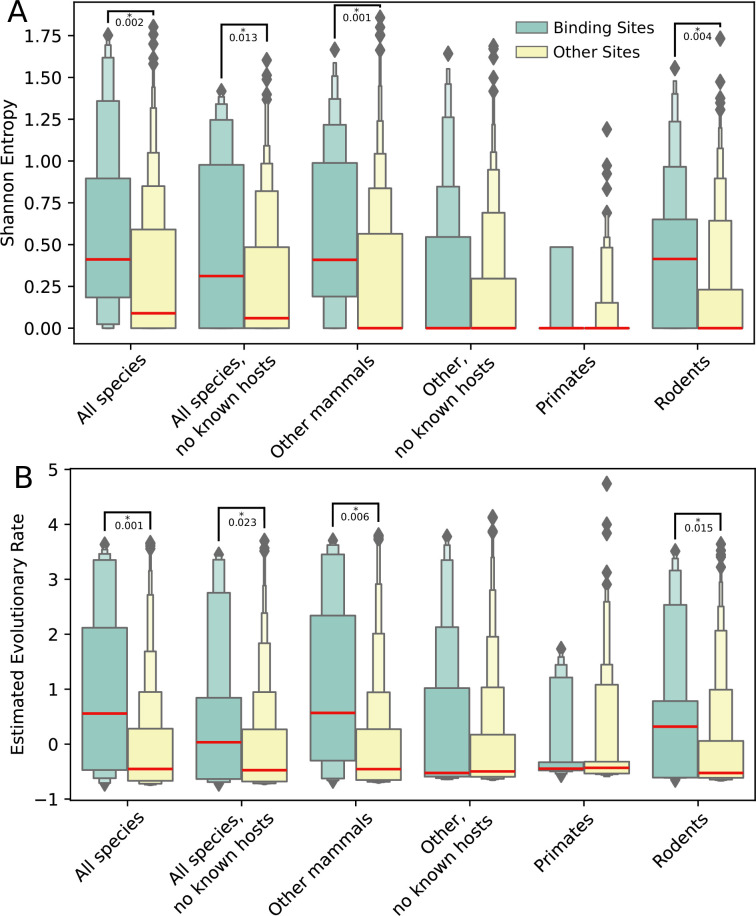
Fig 2. Variation and evolution across the ACE2 receptor at both the spike-binding and other surface-exposed extracellular regions.
Letter-value (or boxen) plots of (A) Shannon entropy and (B) relative evolutionary rate estimates for sites within ACE2 that either bind (green) or do not bind (yellow) the SARS-CoV-2 spike protein, computed using sequences from each of the six species groups (all considered mammalian species, all mammalian species excluding bats, civets and pangolins—i.e., excluding several species that are known Laurasiatheria hosts of SARS-like viruses, along with additional bat species—mammalian species excluding primates and rodents, mammalian species excluding primates, rodents, bats, civets and pangolins, primates only, and rodents only). In letter-value plots, the widest boxes show half the data (from the 25th to 75th percentiles), while each successively narrower box shows half the remaining data. Median values are shown in red. For each measure and species group, comparisons between the binding sites and all other sites that yield P-values less than 0.05 (MWU) are shown. Spike-binding sites within the ACE2 receptor of the rodent, other mammals and “all species” groups have significantly more variation and faster rates of evolution than other surface-exposed extracellular sites, while primates and other mammals without known SARS hosts do not.

