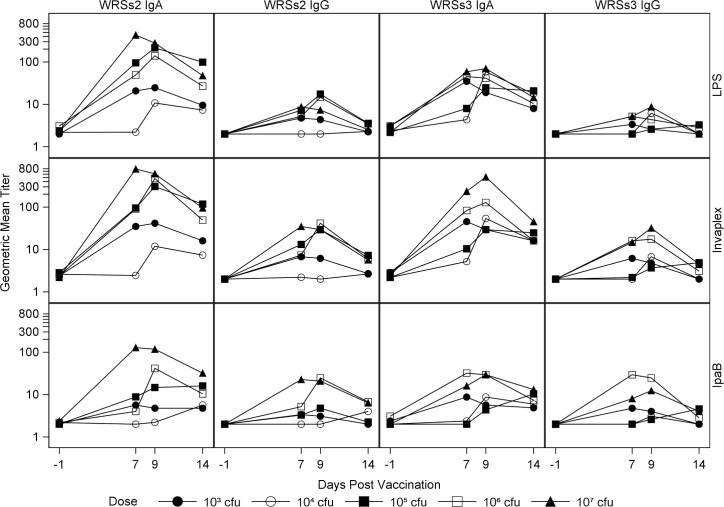
Fig 2. Kinetics of ALS responses following vaccination with WRSs2 and WRSs3.
The Y axis data represents the geometric mean titer (GMT) of the raw ALS titer values at Day -1, Day 7, Day 9, and Day 14. For each S. sonnei antigen, LPS, IVP and IpaB in each cohort (cohorts marks: closed circle-103 CFU, open circle-104 CFU, closed square- 105 CFU, open square- 106 CFU and closed triangle- 107 CFU). The X axis shows the day post-vaccination when ALS was measured.

