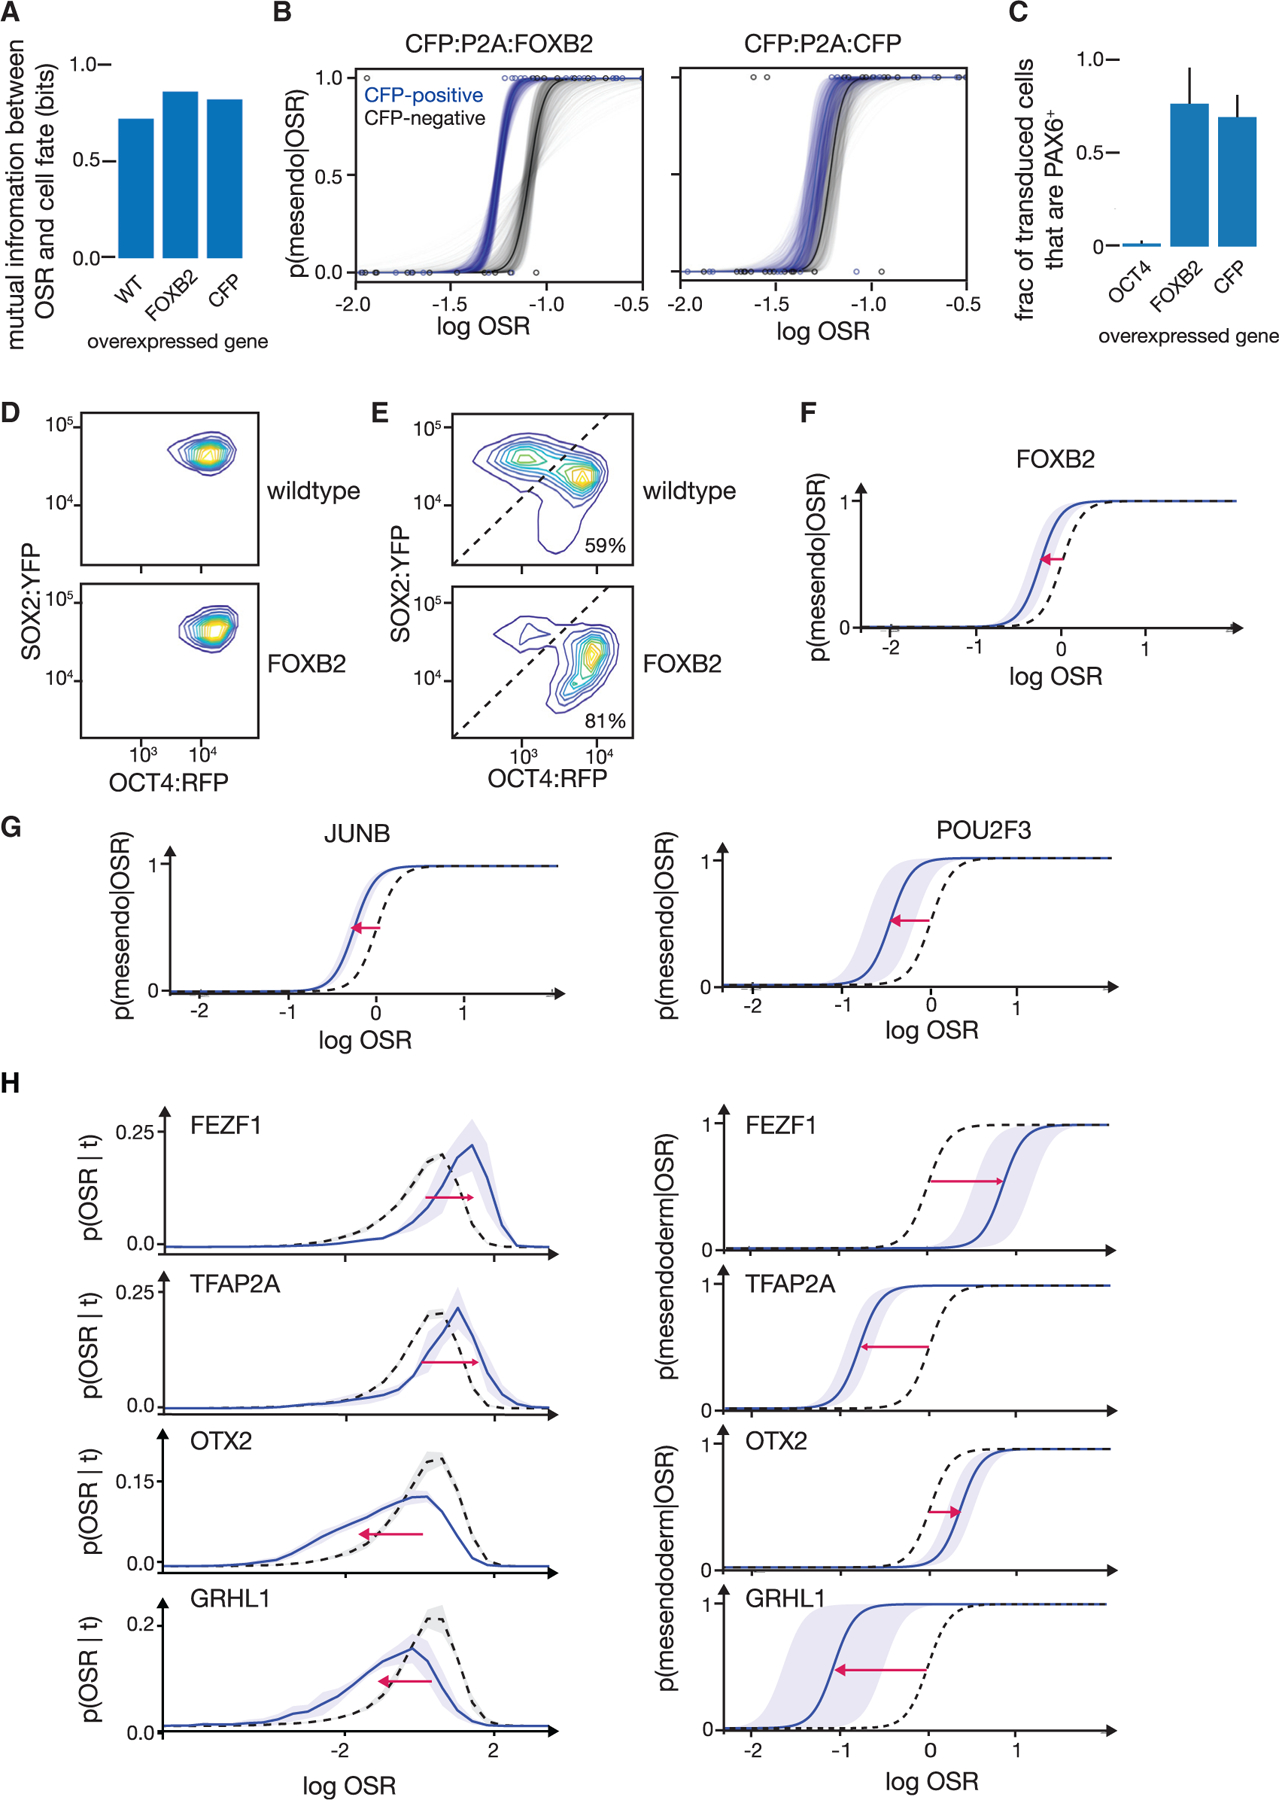
Figure 5. Perturbation of TF candidates from RNA-seq and ATAC-seq analyses tune mesendoderm competence along the ectodermal differentiation trajectory.

(A) Mutual information between final cell fate and OSR at the time of BMP4 + Activin A addition for wild-type, CFP:P2A:FOXB2 transduced, and CFP:P2A:CFP transduced cells. Mutual information was calculated from live, single-cell-tracked time lapse as in Figures 2B–2D. OSR at time of signal addition remains predictive of cell fate during overexpression of FOXB2 or a CFP control.
(B) Measured p(mesendoderm|OSR) for cells transduced with CFP:P2A:FOXB2 (left, blue) or CFP:P2A:CFP (right, blue) compared to the non-transduced cells in the same population (gray). Curves are measured from live-cell time lapses as in Figure 2D. Transparent curves show error as in Figure 2D. Curves are based on the following numbers of tracked cells: FOXB2 transduced, n = 40; FOXB2 non-transduced controls, n = 30; CFP transduced, n = 32; and CFP non-transduced controls, n = 44. FOXB2 overexpression (left) induces a shift that accords mesendoderm competence at lower OSR levels. This shift is not seen upon overexpression of a CFP:P2A:CFP control (right).
(C) Fraction of cells adopting neuroectoderm fate (PAX6+) after 144 h of neuroectodermal differentiation. Cells overexpressing CFP:P2A:FOXB2 or the control CFP:P2A:CFP show normal neuroectodermal differentiation. Overexpression of CFP:P2A:OCT4, a positive control for ectoderm disruption, precludes PAX6 expression. Error bars: SD (n = 3).
(D) (Top) FACS density plot of non-transduced control cells (CFP−) showing distribution ofOCT4:RFP and SOX2:YFP levels of cells after 72 h of activin/NODAL inhibition. (Bottom) CFP:P2A:FOXB2-overexpressing cells (CFP+) from the same population are shown. Overexpression of FOXB2 does not affect OCT4:RFP and SOX2:YFP dynamics during ectodermal differentiation.
(E) FACS density plots (OCT4:RFP versus SOX2:YFP) showing cell fates after 72 h of activin/NODAL inhibition followed by 42 h BMP4 + Activin A treatment. (Top) Non-transduced cells show two peaks corresponding to ectodermal lineage above diagonal (41% of cells) and mesendodermal lineage below diagonal (59% of cells). (Bottom) FOXB2-overexpressing cells (CFP+) from the same population show 81% of cells adopting mesendodermal fate. The ectodermal population shows over 2-fold higher modal SOX2-YFP expression compared to the mesendodermal population. Overexpression of FOXB2 increases the fraction of cells that adopt a mesendodermal fate.
(F) Inference of p(mesendoderm|OSR) from flow cytometry data, given the OSR distribution in (D) and the cell fate fractions in (E). Black dotted: CFP− internal controls; blue: CFP:P2A:FOXB-overexpressing cells, shaded: SD (n = 4). Consistent with microscopy data in (B), overexpression of FOXB2 shifts p(mesendoderm|OSR) to the left and thus accords mesendoderm competence at lower OSR. x axis values between (F) and (B) are not directly comparable as fluorescence values were measured by two different methods.
(G) Inferred p(mesendoderm|OSR) from flow cytometry measurements for cells overexpressing CFP:P2A:JUNB and CFP:P2A:POU2F3. Black dotted: CFP− internal controls; blue: transduced cells; shaded: SD (n = 3). Overexpression of JUNB and POU2F3, like FOXB2, shifts p(mesendoderm|OSR) to accord mesendoderm competence at lower OSR.
(H) Inferred p(mesendoderm|OSR) from flow cytometry measurements for cells overexpressing CFP:P2A:FEZF1, CFP:P2A:TFAP2A, CFP:P2A:OTX2, and CFP:P2A:GRHL1 (top to bottom). Black dotted: CFP− internal controls; blue: transduced cells, shaded: SD (n = 3). (Left) p(OSR|t). (Right) p(mesendoderm|OSR). Overexpression of candidates can tune p(OSR|t) and p(mesendoderm|OSR) independently.
