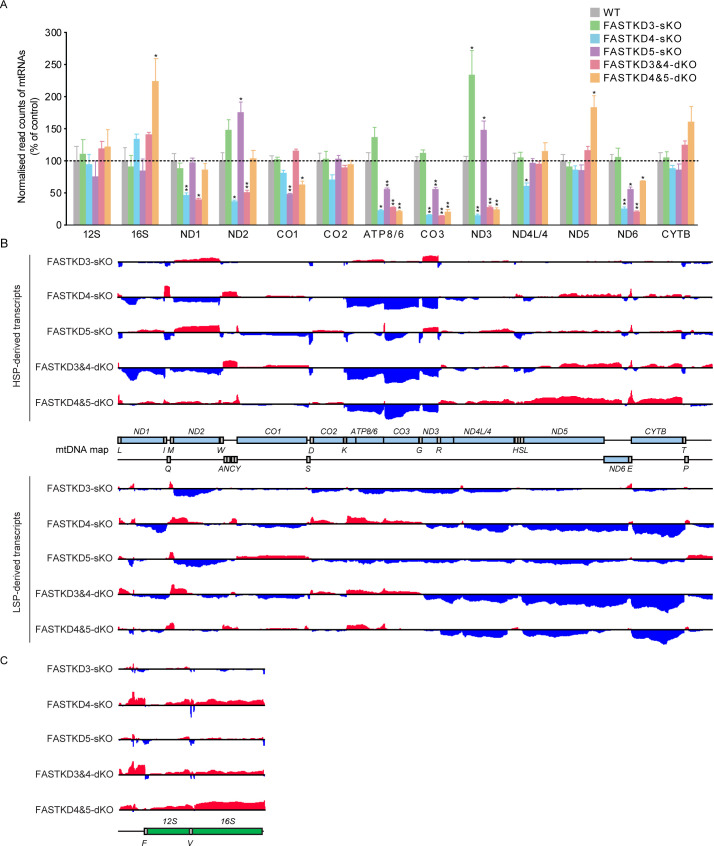
Fig 3. Mitochondrial transcriptome analysis of the FASTKDs-KO cells by RNA-seq.
(A) Relative abundance of read counts normalized to total reads for mitochondrial mRNAs were analyzed. Results are mean±SD *P<0.05, **P<0.01 (Wald test). (B-C) A complete map of mtRNA abundance and mean (log2 fold change [KOmean/Ctrlmean]) determined by RNA-seq coverage from control, FASTKD3-sKO, FASTKD4-sKO, FASTKD5-sKO, FASTKD3&4-dKO, and FASTKD4&5-dKO cells (n = 3). Increases in coding regions (B) and rRNA regions (C) are shown in red, and decreases in coding regions (B) and rRNA regions (C) are shown in blue. The range of the log2 fold changes are from -3 to 2.8.

