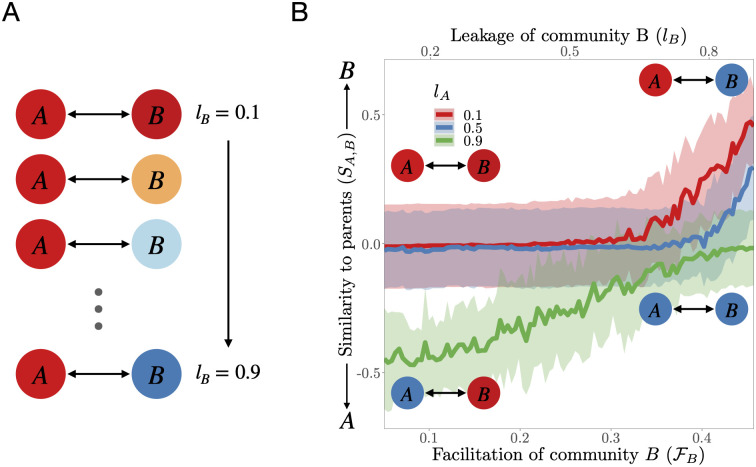
Fig 4. Recursive coalescence between microbial communities.
A: Sketch of the simulation set up. The same pair of communities (A, B) is recursively coalesced, with the leakage of B gradually increasing after each coalescence event for three levels of leakage of A, and 25 replicates per lA value. B: Parent community dominance after coalescence between communities A and B, as a function of facilitation level of community B, (bottom x axis), and leakage of community B, lB (top x axis). Each curve corresponds to a different value of lA. Shaded regions are ±σ. Dominance of parent community B after coalescence increases with lB, implying that higher cooperation levels enhance coalescence success.

