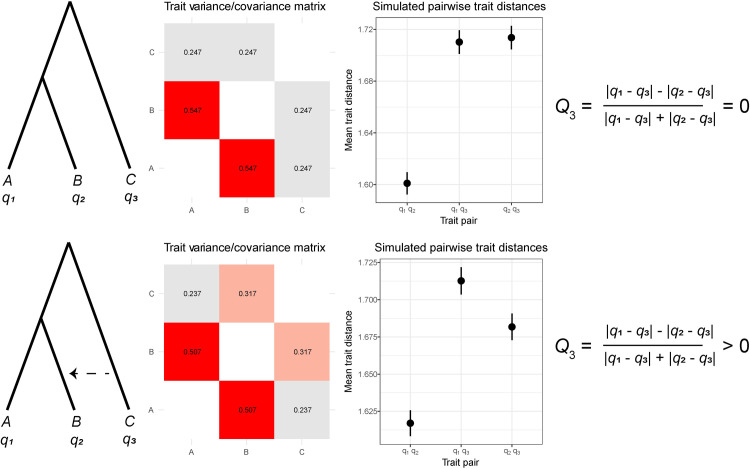
Fig 2. Quantifying the effect of introgression on quantitative trait variation.
For ILS-only (top row) and ILS + introgression (bottom row) conditions, we show the expected variance/covariance matrix (middle-left column, variances not shown for clarity) and the average difference in quantitative trait values between each pair of species across 20,000 simulated traits (middle-right column). The expectations for the Q3 statistic are also shown (far-right column).

