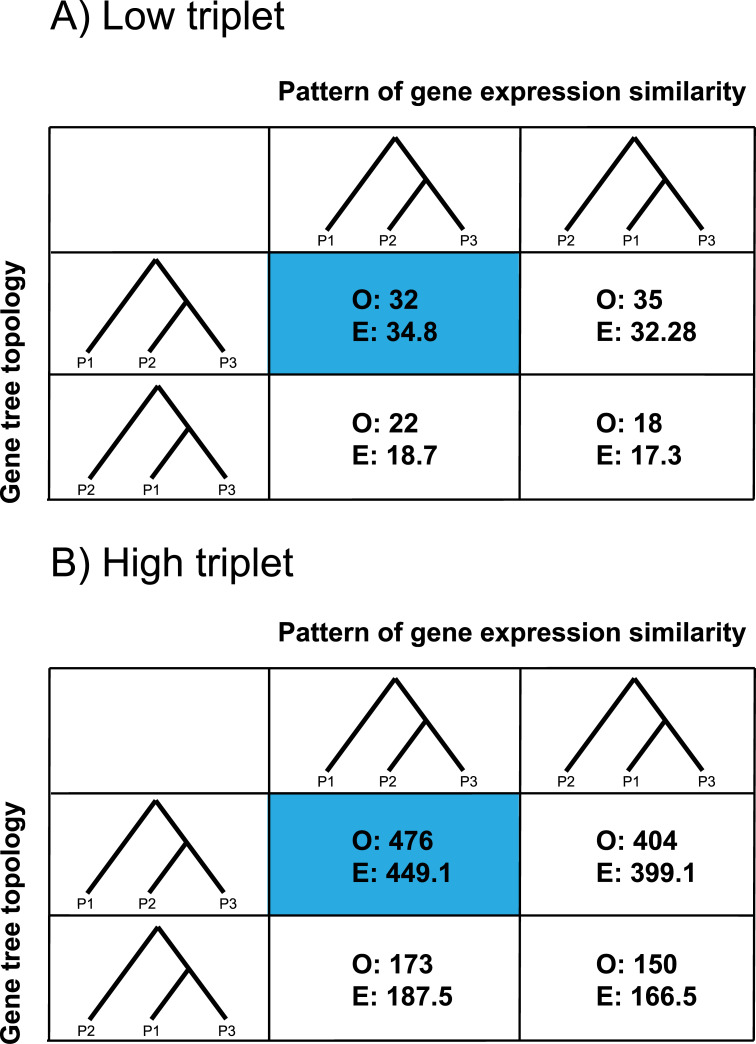
Fig 5.
Relationships between coding sequence tree topology (rows) and gene expression similarity (columns) in the low (A) and high (B) triplets. Note that for expression similarity, we did not explicitly construct trees from expression data—the tree representation is simply meant to depict observed expression distances. Only discordant trees and expression patterns are shown, but χ2 P-values (0.776 and 0.019 for panels A and B, respectively) are reported from the full 3x3 table (see S1 and S2 Tables for the full tables). The cases where both the tree topology and pattern of expression are consistent with the inferred history of introgression for that triplet are highlighted in blue. Each cell reports the observed number of genes (O) in each category, and the number expected (E) from the χ2 distribution.

