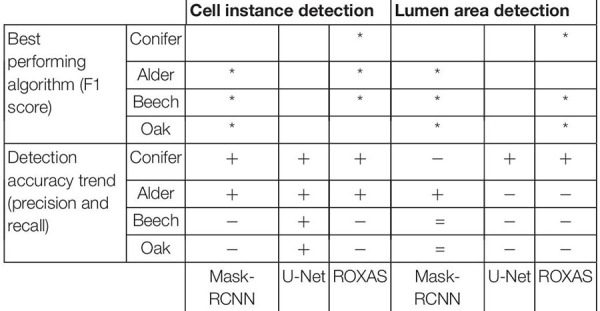
TABLE 5.
Summary result on the comparison of the algorithms’ performances.

|
The best performing algorithm was signaled with an asterisk (*). If the F1 score of a group type reported the same number for more than one approach, the star is represented twice. With respect to the detection accuracy trend, the overestimation both of the cell instance and the lumen area was reported with a plus sign (+), underestimation with a minus (−), and if there was no evident trend an equal symbol was noted (=).
